cuvette Install

Adapter catalog

The programs you already trust, now in plain language.

Ask for an analysis in your own words. The artificial intelligence (AI) model then runs ImageJ, DESeq2, samtools or scanpy the same way that you do. Cuvette is the harness: the software around the model that runs the programs and records each step. An adapter is a small set of files that connects Cuvette to one program. It lists the steps of the program, the settings that can change a result, and known-answer tests.

61 adapters · 15 fields

A known-answer test runs the program on a small data set. Then it compares the result with a known value from a paper, an official tutorial or a separate calculation. 61 of 61 adapters have known-answer tests.

Connection kinds

Plain-language automation of the things you already do.

Each adapter uses one of these eight connection kinds. Cuvette writes each step to the session record, a log of each step, setting and result. You can use the record to repeat a step by hand.

Command line
You type a command in a terminal, a text window for commands. The model runs the same command.
Python library
A Python library is a set of functions that you call from Python code. The model calls the same functions and shows each line of code.
Script
A script is a file of commands that runs from start to end. Examples are an R script for DESeq2 or a batch file for MZmine. The model runs the same script.
Macro
A macro is a short list of commands inside a program such as ImageJ or QuPath. The model writes the macro, and the program runs it.
MCP server
Some programs have a Model Context Protocol (MCP) server. MCP is a standard way for an AI model to send requests to a program. The model sends each step to that server.
Web API
Some programs accept requests over the internet through a web application programming interface (API). The model sends the same requests that you can send.
Files
You edit the input files and read the output files. The model reads and writes the same files.
Screen control
You click the program’s windows and menus. The model clicks the same windows and menus.
Fig. 1 | Imaging. 9 adapters.

Imaging

Count and measure cells and nuclei in microscope images and stained tissue slides. Score staining and measure calcium signals.

Command line

Bio-Formats command line tools

Microscopy: image formats

Reads the metadata of a microscopy image file and converts one series or one plane to OME-TIFF or PNG with the Bio-Formats command line tools showinf and bfconvert.

Name
bftools
Open-source program
Bio-Formats command line tools 8.5.0
Replaces
NIS-Elements, ZEN, LAS X
Trust label
Reviewed
Known-answer tests
7
Citations (1)
  1. Linkert, M., Rueden, C. T., Allan, C., Burel, J.-M., Moore, W., Patterson, A., Loranger, B., Moore, J., Neves, C., MacDonald, D., Tarkowska, A., Sticco, C., Hill, E., Rossner, M., Eliceiri, K. W., & Swedlow, J. R. (2010). Metadata matters: access to image data in the real world. Journal of Cell Biology, 189(5), 777–782. https://doi.org/10.1083/jcb.201004104 doi:10.1083/jcb.201004104
catalog/bftools →

Python library

Calcium imaging

Calcium imaging

Analyzes calcium imaging with NumPy and SciPy.

Name
calcium-imaging
Replaces
MetaMorph (in part), NIS-Elements, ZEN, Inscopix Data Processing (in part), MetaFluor (in part)
Trust label
Reviewed
Known-answer tests
19
Citations (8)
  1. Virtanen, P., Gommers, R., Oliphant, T. E., et al. (2020). SciPy 1.0: fundamental algorithms for scientific computing in Python. Nature Methods, 17(3), 261-272. doi:10.1038/s41592-019-0686-2
  2. Harris, C. R., Millman, K. J., van der Walt, S. J., et al. (2020). Array programming with NumPy. Nature, 585(7825), 357-362. doi:10.1038/s41586-020-2649-2
  3. Pachitariu, M., Stringer, C., Dipoppa, M., Schroder, S., Rossi, L. F., Dalgleish, H., Carandini, M., & Harris, K. D. (2017). Suite2p: beyond 10,000 neurons with standard two-photon microscopy. bioRxiv, 061507. doi:10.1101/061507
  4. Chen, T.-W., Wardill, T. J., Sun, Y., et al. (2013). Ultrasensitive fluorescent proteins for imaging neuronal activity. Nature, 499(7458), 295-300. doi:10.1038/nature12354
  5. Friedrich, J., Zhou, P., & Paninski, L. (2017). Fast online deconvolution of calcium imaging data. PLOS Computational Biology, 13(3), e1005423. doi:10.1371/journal.pcbi.1005423
  6. Welch, B. L. (1947). The generalization of 'Student's' problem when several different population variances are involved. Biometrika, 34(1-2), 28-35. doi:10.1093/biomet/34.1-2.28
  7. Mann, H. B., & Whitney, D. R. (1947). On a test of whether one of two random variables is stochastically larger than the other. The Annals of Mathematical Statistics, 18(1), 50-60. doi:10.1214/aoms/1177730491
  8. Lazic, S. E. (2010). The problem of pseudoreplication in neuroscientific studies: is it affecting your analysis? BMC Neuroscience, 11, 5. doi:10.1186/1471-2202-11-5
catalog/calcium-imaging →

Python library

Cellpose

Microscopy: cell segmentation

Segments cells and nuclei in an image or a folder of images with a Cellpose model, and scores the result against hand-drawn masks.

Name
cellpose
Open-source program
Cellpose 4.2.1.1
Replaces
Imaris (in part), Harmony and Columbus (in part)
Trust label
Reviewed
Known-answer tests
6
Citations (2)
  1. Pachitariu, M., Rariden, M., & Stringer, C. (2025). Cellpose-SAM: superhuman generalization for cellular segmentation. bioRxiv. https://doi.org/10.1101/2025.04.28.651001 doi:10.1101/2025.04.28.651001
  2. Stringer, C., Wang, T., Michaelos, M., & Pachitariu, M. (2021). Cellpose: a generalist algorithm for cellular segmentation. Nature Methods, 18(1), 100–106. https://doi.org/10.1038/s41592-020-01018-x doi:10.1038/s41592-020-01018-x
catalog/cellpose →

Script

CellProfiler

Microscopy: image cytometry

Counts and measures nuclei in microscope images with CellProfiler.

Name
cellprofiler
Open-source program
CellProfiler 4.2.8
Replaces
MetaMorph (in part), Harmony and Columbus (in part)
Trust label
Reviewed
Known-answer tests
6
Citations (4)
  1. Stirling, D. R., Swain-Bowden, M. J., Lucas, A. M., Carpenter, A. E., Cimini, B. A., & Goodman, A. (2021). CellProfiler 4: improvements in speed, utility and usability. BMC Bioinformatics, 22(1), 433. https://doi.org/10.1186/s12859-021-04344-9 doi:10.1186/s12859-021-04344-9
  2. Otsu, N. (1979). A Threshold Selection Method from Gray-Level Histograms. IEEE Transactions on Systems, Man, and Cybernetics, 9(1), 62–66. https://doi.org/10.1109/TSMC.1979.4310076 doi:10.1109/TSMC.1979.4310076
  3. Li, C. H., & Lee, C. K. (1993). Minimum cross entropy thresholding. Pattern Recognition, 26(4), 617–625. https://doi.org/10.1016/0031-3203(93)90115-D doi:10.1016/0031-3203(93)90115-D
  4. Li, C. H., & Tam, P. K. S. (1998). An iterative algorithm for minimum cross entropy thresholding. Pattern Recognition Letters, 19(8), 771–776. https://doi.org/10.1016/S0167-8655(98)00057-9 doi:10.1016/S0167-8655(98)00057-9
catalog/cellprofiler →

Python library

IHC scoring (H-score, Allred, Ki-67)

Histology: staining scores

Scores immunohistochemistry (IHC) stains with the H-score, the Allred score and the Ki-67 labeling index.

Name
ihc-scoring
Open-source program
scikit-image with pandas 0.26.0
Replaces
HALO (in part), Visiopharm (in part), Aperio ImageScope (in part), inForm (in part)
Trust label
Reviewed
Known-answer tests
24
Citations (20)
  1. van der Walt S, Schönberger JL, Nunez-Iglesias J, Boulogne F, Warner JD, Yager N, Gouillart E, Yu T (2014). scikit-image: image processing in Python. PeerJ 2: e453. doi:10.7717/peerj.453
  2. McKinney W (2010). Data structures for statistical computing in Python. Proceedings of the 9th Python in Science Conference: 56-61. doi:10.25080/Majora-92bf1922-00a
  3. Virtanen P, Gommers R, Oliphant TE, et al. (2020). SciPy 1.0: fundamental algorithms for scientific computing in Python. Nature Methods 17: 261-272. doi:10.1038/s41592-019-0686-2
  4. Ruifrok AC, Johnston DA (2001). Quantification of histochemical staining by color deconvolution. Analytical and Quantitative Cytology and Histology 23(4): 291-299. pubmed.ncbi.nlm.nih.gov/11531144/
  5. Bankhead P, Loughrey MB, Fernández JA, et al. (2017). QuPath: Open source software for digital pathology image analysis. Scientific Reports 7: 16878. doi:10.1038/s41598-017-17204-5
  6. Otsu N (1979). A threshold selection method from gray-level histograms. IEEE Transactions on Systems, Man, and Cybernetics 9(1): 62-66. doi:10.1109/TSMC.1979.4310076
  7. Zack GW, Rogers WE, Latt SA (1977). Automatic measurement of sister chromatid exchange frequency. Journal of Histochemistry and Cytochemistry 25(7): 741-753. doi:10.1177/25.7.70454
  8. Li CH, Lee CK (1993). Minimum cross entropy thresholding. Pattern Recognition 26(4): 617-625. doi:10.1016/0031-3203(93)90115-D
  9. Yen JC, Chang FJ, Chang S (1995). A new criterion for automatic multilevel thresholding. IEEE Transactions on Image Processing 4(3): 370-378. doi:10.1109/83.366472
  10. Ridler TW, Calvard S (1978). Picture thresholding using an iterative selection method. IEEE Transactions on Systems, Man, and Cybernetics 8(8): 630-632. doi:10.1109/TSMC.1978.4310039
  11. McCarty KS Jr, Miller LS, Cox EB, Konrath J, McCarty KS Sr (1985). Estrogen receptor analyses. Correlation of biochemical and immunohistochemical methods using monoclonal antireceptor antibodies. Archives of Pathology and Laboratory Medicine 109(8): 716-721. pubmed.ncbi.nlm.nih.gov/3893381/
  12. Allred DC, Harvey JM, Berardo M, Clark GM (1998). Prognostic and predictive factors in breast cancer by immunohistochemical analysis. Modern Pathology 11(2): 155-168. pubmed.ncbi.nlm.nih.gov/9504686/
  13. Harvey JM, Clark GM, Osborne CK, Allred DC (1999). Estrogen receptor status by immunohistochemistry is superior to the ligand-binding assay for predicting response to adjuvant endocrine therapy in breast cancer. Journal of Clinical Oncology 17(5): 1474-1481. doi:10.1200/JCO.1999.17.5.1474
  14. Dowsett M, Nielsen TO, A'Hern R, et al. (2011). Assessment of Ki67 in breast cancer: recommendations from the International Ki67 in Breast Cancer Working Group. Journal of the National Cancer Institute 103(22): 1656-1664. doi:10.1093/jnci/djr393
  15. Nielsen TO, Leung SCY, Rimm DL, et al. (2021). Assessment of Ki67 in breast cancer: updated recommendations from the International Ki67 in Breast Cancer Working Group. Journal of the National Cancer Institute 113(7): 808-819. doi:10.1093/jnci/djaa201
  16. Cohen J (1968). Weighted kappa: nominal scale agreement with provision for scaled disagreement or partial credit. Psychological Bulletin 70(4): 213-220. doi:10.1037/h0026256
  17. Cohen J (1960). A coefficient of agreement for nominal scales. Educational and Psychological Measurement 20(1): 37-46. doi:10.1177/001316446002000104
  18. Shrout PE, Fleiss JL (1979). Intraclass correlations: uses in assessing rater reliability. Psychological Bulletin 86(2): 420-428. doi:10.1037/0033-2909.86.2.420
  19. Koo TK, Li MY (2016). A guideline of selecting and reporting intraclass correlation coefficients for reliability research. Journal of Chiropractic Medicine 15(2): 155-163. doi:10.1016/j.jcm.2016.02.012
  20. Bland JM, Altman DG (1986). Statistical methods for assessing agreement between two methods of clinical measurement. The Lancet 327(8476): 307-310. doi:10.1016/S0140-6736(86)90837-8
catalog/ihc-scoring →

Python library

Bench image assays

Microscopy: bench image assays

Measures bench image assays with scikit-image and SciPy.

Name
image-assays
Open-source program
scikit-image 0.26.0
Replaces
Synbiosis ProtoCOL, Interscience Scan, Volocity (in part), Harmony and Columbus (in part)
Trust label
Reviewed
Known-answer tests
17
Citations (10)
  1. van der Walt, S., Schönberger, J. L., Nunez-Iglesias, J., Boulogne, F., Warner, J. D., Yager, N., Gouillart, E., & Yu, T. (2014). scikit-image: image processing in Python. PeerJ, 2, e453. doi:10.7717/peerj.453
  2. Virtanen, P., Gommers, R., Oliphant, T. E., et al. (2020). SciPy 1.0: fundamental algorithms for scientific computing in Python. Nature Methods, 17(3), 261-272. doi:10.1038/s41592-019-0686-2
  3. Otsu, N. (1979). A threshold selection method from gray-level histograms. IEEE Transactions on Systems, Man, and Cybernetics, 9(1), 62-66. doi:10.1109/TSMC.1979.4310076
  4. Zack, G. W., Rogers, W. E., & Latt, S. A. (1977). Automatic measurement of sister chromatid exchange frequency. Journal of Histochemistry & Cytochemistry, 25(7), 741-753. doi:10.1177/25.7.70454
  5. Li, C. H., & Lee, C. K. (1993). Minimum cross entropy thresholding. Pattern Recognition, 26(4), 617-625. doi:10.1016/0031-3203(93)90115-D
  6. Yen, J. C., Chang, F. J., & Chang, S. (1995). A new criterion for automatic multilevel thresholding. IEEE Transactions on Image Processing, 4(3), 370-378. doi:10.1109/83.366472
  7. Ridler, T. W., & Calvard, S. (1978). Picture thresholding using an iterative selection method. IEEE Transactions on Systems, Man, and Cybernetics, 8(8), 630-632. doi:10.1109/TSMC.1978.4310039
  8. Franken, N. A. P., Rodermond, H. M., Stap, J., Haveman, J., & van Bree, C. (2006). Clonogenic assay of cells in vitro. Nature Protocols, 1(5), 2315-2319. doi:10.1038/nprot.2006.339
  9. Manders, E. M. M., Verbeek, F. J., & Aten, J. A. (1993). Measurement of co-localization of objects in dual-colour confocal images. Journal of Microscopy, 169(3), 375-382. doi:10.1111/j.1365-2818.1993.tb03313.x
  10. Costes, S. V., Daelemans, D., Cho, E. H., Dobbin, Z., Pavlakis, G., & Lockett, S. (2004). Automatic and quantitative measurement of protein-protein colocalization in live cells. Biophysical Journal, 86(6), 3993-4003. doi:10.1529/biophysj.103.038422
catalog/image-assays →

Macro

ImageJ

Microscopy

Counts and measures objects in microscope images with ImageJ.

Name
imagej
Open-source program
ImageJ
Replaces
Imaris (in part), Volocity (in part), MetaMorph (in part), NIS-Elements, ZEN, LAS X
Trust label
Reviewed
Known-answer tests
23
Citations (10)
  1. Schneider, C. A., Rasband, W. S., & Eliceiri, K. W. (2012). NIH Image to ImageJ: 25 years of image analysis. Nature Methods, 9(7), 671–675. https://doi.org/10.1038/nmeth.2089 doi:10.1038/nmeth.2089
  2. Sternberg, S. R. (1983). Biomedical Image Processing. Computer, 16(1), 22–34. https://doi.org/10.1109/MC.1983.1654163 doi:10.1109/MC.1983.1654163
  3. Ridler, T. W., & Calvard, S. (1978). Picture Thresholding Using an Iterative Selection Method. IEEE Transactions on Systems, Man, and Cybernetics, 8(8), 630–632. https://doi.org/10.1109/TSMC.1978.4310039 doi:10.1109/TSMC.1978.4310039
  4. Otsu, N. (1979). A Threshold Selection Method from Gray-Level Histograms. IEEE Transactions on Systems, Man, and Cybernetics, 9(1), 62–66. https://doi.org/10.1109/TSMC.1979.4310076 doi:10.1109/TSMC.1979.4310076
  5. Zack, G. W., Rogers, W. E., & Latt, S. A. (1977). Automatic measurement of sister chromatid exchange frequency. Journal of Histochemistry & Cytochemistry, 25(7), 741–753. https://doi.org/10.1177/25.7.70454 doi:10.1177/25.7.70454
  6. Huang, L.-K., & Wang, M.-J. J. (1995). Image thresholding by minimizing the measures of fuzziness. Pattern Recognition, 28(1), 41–51. https://doi.org/10.1016/0031-3203(94)E0043-K doi:10.1016/0031-3203(94)E0043-K
  7. Li, C. H., & Lee, C. K. (1993). Minimum cross entropy thresholding. Pattern Recognition, 26(4), 617–625. https://doi.org/10.1016/0031-3203(93)90115-D doi:10.1016/0031-3203(93)90115-D
  8. Li, C. H., & Tam, P. K. S. (1998). An iterative algorithm for minimum cross entropy thresholding. Pattern Recognition Letters, 19(8), 771–776. https://doi.org/10.1016/S0167-8655(98)00057-9 doi:10.1016/S0167-8655(98)00057-9
  9. Glasbey, C. A. (1993). An Analysis of Histogram-Based Thresholding Algorithms. CVGIP: Graphical Models and Image Processing, 55(6), 532–537. https://doi.org/10.1006/cgip.1993.1040 doi:10.1006/cgip.1993.1040
  10. Kapur, J. N., Sahoo, P. K., & Wong, A. K. C. (1985). A new method for gray-level picture thresholding using the entropy of the histogram. Computer Vision, Graphics, and Image Processing, 29(3), 273–285. https://doi.org/10.1016/0734-189X(85)90125-2 doi:10.1016/0734-189X(85)90125-2
catalog/imagej →

Macro

QuPath

Histology

Counts cells and positive cells in stained tissue images with QuPath.

Name
qupath
Open-source program
QuPath 0.7.0
Replaces
HALO (in part), Visiopharm (in part), Aperio ImageScope (in part), inForm (in part)
Trust label
Reviewed
Known-answer tests
17
Citations (2)
  1. Bankhead, P., Loughrey, M. B., Fernández, J. A., Dombrowski, Y., McArt, D. G., Dunne, P. D., McQuaid, S., Gray, R. T., Murray, L. J., Coleman, H. G., James, J. A., Salto-Tellez, M., & Hamilton, P. W. (2017). QuPath: Open source software for digital pathology image analysis. Scientific Reports, 7(1), 16878. https://doi.org/10.1038/s41598-017-17204-5 doi:10.1038/s41598-017-17204-5
  2. Ruifrok, A. C., & Johnston, D. A. (2001). Quantification of histochemical staining by color deconvolution. Analytical and Quantitative Cytology and Histology, 23(4), 291–299. https://pubmed.ncbi.nlm.nih.gov/11531144/ pubmed.ncbi.nlm.nih.gov/11531144/
catalog/qupath →

Python library

scikit-image

Image analysis

Finds and counts objects such as nuclei in an image or a folder of images with scikit-image (threshold, label, watershed) and scores the result against hand-drawn masks.

Name
scikit-image
Open-source program
scikit-image 0.26.0
Replaces
MATLAB (in part), Imaris (in part)
Trust label
Reviewed
Known-answer tests
8
Citations (9)
  1. van der Walt, S., Schönberger, J. L., Nunez-Iglesias, J., Boulogne, F., Warner, J. D., Yager, N., Gouillart, E., & Yu, T. (2014). scikit-image: image processing in Python. PeerJ, 2, e453. https://doi.org/10.7717/peerj.453 doi:10.7717/peerj.453
  2. Otsu, N. (1979). A Threshold Selection Method from Gray-Level Histograms. IEEE Transactions on Systems, Man, and Cybernetics, 9(1), 62–66. https://doi.org/10.1109/TSMC.1979.4310076 doi:10.1109/TSMC.1979.4310076
  3. Li, C. H., & Lee, C. K. (1993). Minimum cross entropy thresholding. Pattern Recognition, 26(4), 617–625. https://doi.org/10.1016/0031-3203(93)90115-D doi:10.1016/0031-3203(93)90115-D
  4. Li, C. H., & Tam, P. K. S. (1998). An iterative algorithm for minimum cross entropy thresholding. Pattern Recognition Letters, 19(8), 771–776. https://doi.org/10.1016/S0167-8655(98)00057-9 doi:10.1016/S0167-8655(98)00057-9
  5. Zack, G. W., Rogers, W. E., & Latt, S. A. (1977). Automatic measurement of sister chromatid exchange frequency. Journal of Histochemistry & Cytochemistry, 25(7), 741–753. https://doi.org/10.1177/25.7.70454 doi:10.1177/25.7.70454
  6. Ridler, T. W., & Calvard, S. (1978). Picture Thresholding Using an Iterative Selection Method. IEEE Transactions on Systems, Man, and Cybernetics, 8(8), 630–632. https://doi.org/10.1109/TSMC.1978.4310039 doi:10.1109/TSMC.1978.4310039
  7. Yen, J.-C., Chang, F.-J., & Chang, S. (1995). A new criterion for automatic multilevel thresholding. IEEE Transactions on Image Processing, 4(3), 370–378. https://doi.org/10.1109/83.366472 doi:10.1109/83.366472
  8. Glasbey, C. A. (1993). An Analysis of Histogram-Based Thresholding Algorithms. CVGIP: Graphical Models and Image Processing, 55(6), 532–537. https://doi.org/10.1006/cgip.1993.1040 doi:10.1006/cgip.1993.1040
  9. Prewitt, J. M. S., & Mendelsohn, M. L. (1966). The analysis of cell images. Annals of the New York Academy of Sciences, 128(3), 1035–1053. https://doi.org/10.1111/j.1749-6632.1965.tb11715.x doi:10.1111/j.1749-6632.1965.tb11715.x
catalog/scikit-image →
Fig. 2 | Flow and mass cytometry. 3 adapters.

Flow and mass cytometry

Count cell populations in flow cytometry and mass cytometry files. Correct the spillover, cluster cells and compare groups.

Script

Mass cytometry clustering and population frequencies (FlowSOM, diffcyt)

Mass cytometry

Clusters mass cytometry or flow cytometry FCS files with arcsinh and FlowSOM.

Name
cytof
Open-source program
FlowSOM 2.20.0
Replaces
FCS Express (in part), Cytobank (in part), OMIQ (in part)
Trust label
Reviewed
Known-answer tests
12
Citations (9)
  1. Van Gassen, S., Callebaut, B., Van Helden, M. J., Lambrecht, B. N., Demeester, P., Dhaene, T., & Saeys, Y. (2015). FlowSOM: Using self-organizing maps for visualization and interpretation of cytometry data. Cytometry Part A, 87(7), 636-645. https://doi.org/10.1002/cyto.a.22625 doi:10.1002/cyto.a.22625
  2. Weber, L. M., Nowicka, M., Soneson, C., & Robinson, M. D. (2019). diffcyt: Differential discovery in high-dimensional cytometry via high-resolution clustering. Communications Biology, 2, 183. https://doi.org/10.1038/s42003-019-0415-5 doi:10.1038/s42003-019-0415-5
  3. Hahne, F., LeMeur, N., Brinkman, R. R., Ellis, B., Haaland, P., Sarkar, D., Spidlen, J., Strain, E., & Gentleman, R. (2009). flowCore: a Bioconductor package for high throughput flow cytometry. BMC Bioinformatics, 10, 106. https://doi.org/10.1186/1471-2105-10-106 doi:10.1186/1471-2105-10-106
  4. Wilkerson, M. D., & Hayes, D. N. (2010). ConsensusClusterPlus: a class discovery tool with confidence assessments and item tracking. Bioinformatics, 26(12), 1572-1573. https://doi.org/10.1093/bioinformatics/btq170 doi:10.1093/bioinformatics/btq170
  5. Nowicka, M., Krieg, C., Crowell, H. L., Weber, L. M., Hartmann, F. J., Guglietta, S., Becher, B., Levesque, M. P., & Robinson, M. D. (2019). CyTOF workflow: differential discovery in high-throughput high-dimensional cytometry datasets. F1000Research, 6, 748. https://doi.org/10.12688/f1000research.11622.3 doi:10.12688/f1000research.11622.3
  6. Benjamini, Y., & Hochberg, Y. (1995). Controlling the false discovery rate: a practical and powerful approach to multiple testing. Journal of the Royal Statistical Society B, 57(1), 289-300. https://doi.org/10.1111/j.2517-6161.1995.tb02031.x doi:10.1111/j.2517-6161.1995.tb02031.x
  7. Bates, D., Maechler, M., Bolker, B., & Walker, S. (2015). Fitting linear mixed-effects models using lme4. Journal of Statistical Software, 67(1), 1-48. https://doi.org/10.18637/jss.v067.i01 doi:10.18637/jss.v067.i01
  8. Robinson, M. D., McCarthy, D. J., & Smyth, G. K. (2010). edgeR: a Bioconductor package for differential expression analysis of digital gene expression data. Bioinformatics, 26(1), 139-140. https://doi.org/10.1093/bioinformatics/btp616 doi:10.1093/bioinformatics/btp616
  9. Law, C. W., Chen, Y., Shi, W., & Smyth, G. K. (2014). voom: precision weights unlock linear model analysis tools for RNA-seq read counts. Genome Biology, 15(2), R29. https://doi.org/10.1186/gb-2014-15-2-r29 doi:10.1186/gb-2014-15-2-r29
catalog/cytof →

Script

flowCore (spillover from single-stain controls, percent positive and MFI)

Flow cytometry: spillover and populations

Computes a spillover matrix from single-stain controls with the R package flowCore data structures.

Name
flowcore
Open-source program
flowCore 2.24.0
Replaces
FlowJo
Trust label
Reviewed
Known-answer tests
8
Citations (2)
  1. Ellis B, Haaland P, Hahne F, Le Meur N, Gopalakrishnan N, Spidlen J, Jiang M, Finak G. flowCore: Basic structures for flow cytometry data. Bioconductor R package version 2.24.0. doi:10.18129/B9.bioc.flowCore
  2. Hahne F, LeMeur N, Brinkman RR, Ellis B, Haaland P, Sarkar D, Spidlen J, Strain E, Gentleman R (2009). flowCore: a Bioconductor package for high throughput flow cytometry. BMC Bioinformatics 10: 106. doi:10.1186/1471-2105-10-106
catalog/flowcore →

Python library

FlowKit (flow cytometry)

Flow cytometry: gating

Reads FCS files and counts events per gate with FlowKit.

Name
flowkit
Open-source program
FlowKit
Replaces
FlowJo, FCS Express (in part)
Trust label
Reviewed
Known-answer tests
13
Citations (3)
  1. White, S., Quinn, J., Enzor, J., Staats, J., Mosier, S. M., Almarode, J., Denny, T. N., Weinhold, K. J., Ferrari, G., & Chan, C. (2021). FlowKit: A Python Toolkit for Integrated Manual and Automated Cytometry Analysis Workflows. Frontiers in Immunology, 12, 768541. https://doi.org/10.3389/fimmu.2021.768541 doi:10.3389/fimmu.2021.768541
  2. Parks, D. R., Roederer, M., & Moore, W. A. (2006). A new ``Logicle'' display method avoids deceptive effects of logarithmic scaling for low signals and compensated data. Cytometry Part A, 69A(6), 541–551. https://doi.org/10.1002/cyto.a.20258 doi:10.1002/cyto.a.20258
  3. Bagwell, C. B. (2005). Hyperlog: A flexible log-like transform for negative, zero, and positive valued data. Cytometry Part A, 64A(1), 34–42. https://doi.org/10.1002/cyto.a.20114 doi:10.1002/cyto.a.20114
catalog/flowkit →
Fig. 3 | Mass spectrometry. 10 adapters.

Mass spectrometry

Find peaks, identify peptides and show where molecules are in a tissue section. Compare protein and metabolite tables.

Script

Cardinal (mass spectrometry imaging)

Mass spectrometry imaging

Reads a mass spectrometry imaging run in R, picks peaks, splits the image into segments with spatial shrunken centroids, and lists the ions of each segment.

Name
cardinal
Open-source program
Cardinal 3.14.0
Replaces
None in the program map
Trust label
Reviewed
Known-answer tests
4
Citations (3)
  1. Bemis, K. A., Föll, M. C., Guo, D., Lakkimsetty, S. S., & Vitek, O. (2023). Cardinal v.3: a versatile open-source software for mass spectrometry imaging analysis. Nature Methods, 20(12), 1883–1886. https://doi.org/10.1038/s41592-023-02070-z doi:10.1038/s41592-023-02070-z
  2. Bemis, K. D., Harry, A., Eberlin, L. S., Ferreira, C., van de Ven, S. M., Mallick, P., Stolowitz, M., & Vitek, O. (2015). Cardinal: an R package for statistical analysis of mass spectrometry-based imaging experiments. Bioinformatics, 31(14), 2418–2420. https://doi.org/10.1093/bioinformatics/btv146 doi:10.1093/bioinformatics/btv146
  3. Bemis, K. D., Harry, A., Eberlin, L. S., Ferreira, C. R., van de Ven, S. M., Mallick, P., Stolowitz, M., & Vitek, O. (2016). Probabilistic Segmentation of Mass Spectrometry (MS) Images Helps Select Important Ions and Characterize Confidence in the Resulting Segments. Molecular & Cellular Proteomics, 15(5), 1761–1772. https://doi.org/10.1074/mcp.O115.053918 doi:10.1074/mcp.O115.053918
catalog/cardinal →

Script

limma for protein tables (differential proteins)

Proteomics: protein tables

Finds differentially abundant proteins in a quantified protein table, such as MaxQuant proteinGroups.txt, a DIA-NN or Spectronaut report, or a Proteome Discoverer export.

Name
limma-proteomics
Open-source program
limma 3.68.5
Replaces
Partek Flow and Genomics Suite (in part), MaxQuant and Perseus (in part), Spectronaut (in part), Proteome Discoverer
Trust label
Reviewed
Known-answer tests
10
Citations (5)
  1. Ritchie ME, Phipson B, Wu D, Hu Y, Law CW, Shi W, Smyth GK (2015). limma powers differential expression analyses for RNA-sequencing and microarray studies. Nucleic Acids Research 43(7): e47. doi:10.1093/nar/gkv007
  2. Smyth GK (2004). Linear models and empirical Bayes methods for assessing differential expression in microarray experiments. Statistical Applications in Genetics and Molecular Biology 3: Article 3. doi:10.2202/1544-6115.1027
  3. Benjamini Y, Hochberg Y (1995). Controlling the false discovery rate: a practical and powerful approach to multiple testing. Journal of the Royal Statistical Society B 57(1): 289-300. doi:10.1111/j.2517-6161.1995.tb02031.x
  4. Phipson B, Lee S, Majewski IJ, Alexander WS, Smyth GK (2016). Robust hyperparameter estimation protects against hypervariable genes and improves power to detect differential expression. Annals of Applied Statistics 10(2): 946-963. doi:10.1214/16-AOAS920
  5. Law CW, Chen Y, Shi W, Smyth GK (2014). voom: precision weights unlock linear model analysis tools for RNA-seq read counts. Genome Biology 15: R29. doi:10.1186/gb-2014-15-2-r29
catalog/limma-proteomics →

Script

ropls (metabolomics statistics from a feature table)

Metabolomics statistics

Analyzes a processed metabolite feature table with the R package ropls.

Name
metabolomics-stats
Open-source program
ropls 1.44.0
Replaces
MetaboAnalyst (web server), SIMCA (in part)
Trust label
Reviewed
Known-answer tests
23
Citations (8)
  1. Thevenot, E. A., Roux, A., Xu, Y., Ezan, E., & Junot, C. (2015). Analysis of the human adult urinary metabolome variations with age, body mass index, and gender by implementing a comprehensive workflow for univariate and OPLS statistical analyses. Journal of Proteome Research, 14(8), 3322-3335. https://doi.org/10.1021/acs.jproteome.5b00354 doi:10.1021/acs.jproteome.5b00354
  2. Dieterle, F., Ross, A., Schlotterbeck, G., & Senn, H. (2006). Probabilistic quotient normalization as robust method to account for dilution of complex biological mixtures. Analytical Chemistry, 78(13), 4281-4290. https://doi.org/10.1021/ac051632c doi:10.1021/ac051632c
  3. van den Berg, R. A., Hoefsloot, H. C. J., Westerhuis, J. A., Smilde, A. K., & van der Werf, M. J. (2006). Centering, scaling, and transformations: improving the biological information content of metabolomics data. BMC Genomics, 7, 142. https://doi.org/10.1186/1471-2164-7-142 doi:10.1186/1471-2164-7-142
  4. Trygg, J., & Wold, S. (2002). Orthogonal projections to latent structures (O-PLS). Journal of Chemometrics, 16(3), 119-128. https://doi.org/10.1002/cem.695 doi:10.1002/cem.695
  5. Wold, S., Sjostrom, M., & Eriksson, L. (2001). PLS-regression: a basic tool of chemometrics. Chemometrics and Intelligent Laboratory Systems, 58(2), 109-130. https://doi.org/10.1016/S0169-7439(01)00155-1 doi:10.1016/S0169-7439(01)00155-1
  6. Szymanska, E., Saccenti, E., Smilde, A. K., & Westerhuis, J. A. (2012). Double-check: validation of diagnostic statistics for PLS-DA models in metabolomics studies. Metabolomics, 8(Suppl 1), 3-16. https://doi.org/10.1007/s11306-011-0330-3 doi:10.1007/s11306-011-0330-3
  7. Benjamini, Y., & Hochberg, Y. (1995). Controlling the false discovery rate: a practical and powerful approach to multiple testing. Journal of the Royal Statistical Society B, 57(1), 289-300. https://doi.org/10.1111/j.2517-6161.1995.tb02031.x doi:10.1111/j.2517-6161.1995.tb02031.x
  8. Welch, B. L. (1947). The generalization of 'Student's' problem when several different population variances are involved. Biometrika, 34(1-2), 28-35. https://doi.org/10.1093/biomet/34.1-2.28 doi:10.1093/biomet/34.1-2.28
catalog/metabolomics-stats →

Python library

METASPACE public annotations

Mass spectrometry imaging

Searches public METASPACE datasets, reads their metadata, lists annotations at an FDR level and database, counts annotations at FDR 5, 10 and 20 percent, and saves one ion image as a PNG file.

Name
metaspace
Open-source program
METASPACE 2.0.9
Replaces
None in the program map
Trust label
Reviewed
Known-answer tests
11
Citations (2)
  1. Palmer, A., Phapale, P., Chernyavsky, I., Lavigne, R., Fay, D., Tarasov, A., Kovalev, V., Fuchser, J., Nikolenko, S., Pineau, C., Becker, M., & Alexandrov, T. (2017). FDR-controlled metabolite annotation for high-resolution imaging mass spectrometry. Nature Methods, 14(1), 57–60. https://doi.org/10.1038/nmeth.4072 doi:10.1038/nmeth.4072
  2. Alexandrov, T., Ovchinnikova, K., Palmer, A., Kovalev, V., Tarasov, A., Stuart, L., Nigmetzianov, R., Fay, D., et al. (2019). METASPACE: A community-populated knowledge base of spatial metabolomes in health and disease [Computer software]. bioRxiv preprint 539478. https://doi.org/10.1101/539478 doi:10.1101/539478
catalog/metaspace →

Script

MZmine

Mass spectrometry: LC-MS

Finds LC-MS features in mzML files with MZmine batch mode.

Name
mzmine
Open-source program
MZmine 4.10.90
Replaces
MassHunter
Trust label
Reviewed
Known-answer tests
5
Citations (2)
  1. Schmid, R., Heuckeroth, S., Korf, A., Smirnov, A., Myers, O., Dyrlund, T. S., Bushuiev, R., Murray, K. J., Hoffmann, N., Lu, M., . . . Pluskal, T. (2023). Integrative analysis of multimodal mass spectrometry data in MZmine 3. Nature Biotechnology, 41(4), 447–449. https://doi.org/10.1038/s41587-023-01690-2 doi:10.1038/s41587-023-01690-2
  2. Myers, O. D., Sumner, S. J., Li, S., Barnes, S., & Du, X. (2017). Detailed Investigation and Comparison of the XCMS and MZmine 2 Chromatogram Construction and Chromatographic Peak Detection Methods for Preprocessing Mass Spectrometry Metabolomics Data. Analytical Chemistry, 89(17), 8689–8695. https://doi.org/10.1021/acs.analchem.7b01069 doi:10.1021/acs.analchem.7b01069
catalog/mzmine →

Command line

OpenMS TOPP tools for peptide data

Proteomics

Runs four OpenMS TOPP command line tools on proteomics files: FileInfo, FeatureFinderCentroided, PeptideIndexer and FalseDiscoveryRate.

Name
openms
Open-source program
OpenMS TOPP tools 3.5.0
Replaces
MaxQuant and Perseus (in part), MassHunter, Xcalibur and FreeStyle (in part), Spectronaut (in part), Proteome Discoverer
Trust label
Reviewed
Known-answer tests
6
Citations (3)
  1. Pfeuffer, J., Bielow, C., Wein, S., Jeong, K., Netz, E., Walter, A., Alka, O., Nilse, L., Colaianni, P. D., McCloskey, D., et al. (2024). OpenMS 3 enables reproducible analysis of large-scale mass spectrometry data. Nature Methods, 21(3), 365–367. https://doi.org/10.1038/s41592-024-02197-7 doi:10.1038/s41592-024-02197-7
  2. Röst, H. L., Sachsenberg, T., Aiche, S., Bielow, C., Weisser, H., Aicheler, F., Andreotti, S., Ehrlich, H.-C., Gutenbrunner, P., Kenar, E., et al. (2016). OpenMS: a flexible open-source software platform for mass spectrometry data analysis. Nature Methods, 13(9), 741–748. https://doi.org/10.1038/nmeth.3959 doi:10.1038/nmeth.3959
  3. Elias, J. E., & Gygi, S. P. (2007). Target-decoy search strategy for increased confidence in large-scale protein identifications by mass spectrometry. Nature Methods, 4(3), 207–214. https://doi.org/10.1038/nmeth1019 doi:10.1038/nmeth1019
catalog/openms →

Python library

pyimzML reader for imzML mass spectrometry imaging files

Mass spectrometry imaging

Reads any imzML file with pyimzML.

Name
pyimzml
Open-source program
pyimzML 1.5.5
Replaces
None in the program map
Trust label
Reviewed
Known-answer tests
10
Citations (2)
  1. pyimzML [Computer software]. Alexandrov Team, EMBL. https://github.com/alexandrovteam/pyimzML github.com/alexandrovteam/pyimzML
  2. Schramm, T., Hester, Z., Klinkert, I., Both, J.-P., Heeren, R. M. A., Brunelle, A., Laprévote, O., Desbenoit, N., Robbe, M.-F., Stoeckli, M., Spengler, B., & Römpp, A. (2012). imzML – A common data format for the flexible exchange and processing of mass spectrometry imaging data. Journal of Proteomics, 75(16), 5106–5110. https://doi.org/10.1016/j.jprot.2012.07.026 doi:10.1016/j.jprot.2012.07.026
catalog/pyimzml →

Python library

pyOpenMS for LC-MS files and formula masses

Reads mzML files, picks peaks, finds LC-MS features with the OpenMS metabolite feature finder, and calculates monoisotopic masses, adduct m/z values and isotope patterns of a formula.

Name
pyopenms
Open-source program
pyOpenMS 3.6.0
Replaces
MaxQuant and Perseus (in part), MassHunter, Xcalibur and FreeStyle (in part)
Trust label
Reviewed
Known-answer tests
9
Citations (3)
  1. Röst, H. L., Schmitt, U., Aebersold, R., & Malmström, L. (2014). pyOpenMS: A Python-based interface to the OpenMS mass-spectrometry algorithm library. Proteomics, 14(1), 74–77. https://doi.org/10.1002/pmic.201300246 doi:10.1002/pmic.201300246
  2. Pfeuffer, J., Bielow, C., Wein, S., Jeong, K., Netz, E., Walter, A., Alka, O., Nilse, L., Colaianni, P. D., McCloskey, D., et al. (2024). OpenMS 3 enables reproducible analysis of large-scale mass spectrometry data. Nature Methods, 21(3), 365–367. https://doi.org/10.1038/s41592-024-02197-7 doi:10.1038/s41592-024-02197-7
  3. Kenar, E., Franken, H., Forcisi, S., Wörmann, K., Häring, H.-U., Lehmann, R., Schmitt-Kopplin, P., Zell, A., & Kohlbacher, O. (2014). Automated Label-free Quantification of Metabolites from Liquid Chromatography–Mass Spectrometry Data. Molecular & Cellular Proteomics, 13(1), 348–359. https://doi.org/10.1074/mcp.M113.031278 doi:10.1074/mcp.M113.031278
catalog/pyopenms →

Command line

Sage peptide search

Proteomics

Searches MS2 spectra against a protein database with the Sage search engine, then counts the PSMs and peptides that pass a chosen FDR.

Name
sage
Open-source program
Sage 0.14.6
Replaces
MaxQuant and Perseus (in part), Proteome Discoverer, PEAKS Studio (in part)
Trust label
Reviewed
Known-answer tests
4
Citations (2)
  1. Lazear, M. R. (2023). Sage: An Open-Source Tool for Fast Proteomics Searching and Quantification at Scale. Journal of Proteome Research, 22(11), 3652–3659. https://doi.org/10.1021/acs.jproteome.3c00486 doi:10.1021/acs.jproteome.3c00486
  2. Elias, J. E., & Gygi, S. P. (2007). Target-decoy search strategy for increased confidence in large-scale protein identifications by mass spectrometry. Nature Methods, 4(3), 207–214. https://doi.org/10.1038/nmeth1019 doi:10.1038/nmeth1019
catalog/sage →

MCP server

SMILE MSI

Mass spectrometry imaging

MALDI mass spectrometry imaging of lipids.

Name
smile-msi
Open-source program
SMILE MSI 2.0.0
Replaces
None in the program map
Trust label
Reviewed
Known-answer tests
7
Citations (1)
  1. SMILE MSI (Version 2.0.0) [Computer software]. https://github.com/elparko/SMILE-MSI github.com/elparko/SMILE-MSI
catalog/smile-msi →
Fig. 4 | Genomics. 13 adapters.

Genomics

Check sequencing reads, count variants and compare gene expression between groups of samples. Find enriched gene sets, hit genes and shared factors.

Command line

bcftools

Genomics: variant calls

Counts, filters and normalizes variants in a VCF file with bcftools.

Name
bcftools
Open-source program
bcftools 1.24
Replaces
CLC Genomics Workbench (in part)
Trust label
Reviewed
Known-answer tests
7
Citations (1)
  1. Danecek, P., Bonfield, J. K., Liddle, J., Marshall, J., Ohan, V., Pollard, M. O., Whitwham, A., Keane, T., McCarthy, S. A., Davies, R. M., & Li, H. (2021). Twelve years of SAMtools and BCFtools. GigaScience, 10(2), giab008. https://doi.org/10.1093/gigascience/giab008 doi:10.1093/gigascience/giab008
catalog/bcftools →

Command line

bedtools

Genomics: genomic intervals

Finds overlaps between genome intervals, merges intervals and measures coverage with bedtools.

Name
bedtools
Open-source program
bedtools 2.31.1
Replaces
CLC Genomics Workbench (in part)
Trust label
Reviewed
Known-answer tests
7
Citations (1)
  1. Quinlan, A. R., & Hall, I. M. (2010). BEDTools: a flexible suite of utilities for comparing genomic features. Bioinformatics, 26(6), 841–842. https://doi.org/10.1093/bioinformatics/btq033 doi:10.1093/bioinformatics/btq033
catalog/bedtools →

Script

DESeq2 (RNA-seq differential expression)

Transcriptomics: RNA sequencing

Tests for differential gene expression in RNA-seq data with DESeq2 in R.

Name
deseq2
Open-source program
DESeq2 1.52.0
Replaces
Partek Flow and Genomics Suite (in part), CLC Genomics Workbench (in part)
Trust label
Reviewed
Known-answer tests
14
Citations (3)
  1. Love, M. I., Huber, W., & Anders, S. (2014). Moderated estimation of fold change and dispersion for RNA-seq data with DESeq2. Genome Biology, 15(12), 550. https://doi.org/10.1186/s13059-014-0550-8 doi:10.1186/s13059-014-0550-8
  2. Benjamini, Y., & Hochberg, Y. (1995). Controlling the False Discovery Rate: A Practical and Powerful Approach to Multiple Testing. Journal of the Royal Statistical Society: Series B (Methodological), 57(1), 289–300. https://doi.org/10.1111/j.2517-6161.1995.tb02031.x doi:10.1111/j.2517-6161.1995.tb02031.x
  3. Soneson, C., Love, M. I., & Robinson, M. D. (2015). Differential analyses for RNA-seq: transcript-level estimates improve gene-level inferences. F1000Research, 4, 1521. https://doi.org/10.12688/f1000research.7563.1 doi:10.12688/f1000research.7563.1
catalog/deseq2 →

Script

DiffBind (differential binding and accessibility of ChIP-seq and ATAC-seq peaks)

Epigenomics: ChIP-seq and ATAC-seq peaks

Counts the reads in the peaks of a ChIP-seq or ATAC-seq experiment with DiffBind.

Name
diffbind
Open-source program
DiffBind 3.22.2
Replaces
Partek Flow and Genomics Suite (in part)
Trust label
Reviewed
Known-answer tests
11
Citations (4)
  1. Stark, R., & Brown, G. (2011). DiffBind: differential binding analysis of ChIP-Seq peak data. Bioconductor. https://bioconductor.org/packages/DiffBind bioconductor.org/packages/DiffBind
  2. Ross-Innes, C. S., Stark, R., Teschendorff, A. E., Holmes, K. A., Ali, H. R., Dunning, M. J., Brown, G. D., Gojis, O., Ellis, I. O., Green, A. R., Ali, S., Chin, S.-F., Palmieri, C., Caldas, C., & Carroll, J. S. (2012). Differential oestrogen receptor binding is associated with clinical outcome in breast cancer. Nature, 481, 389-393. https://doi.org/10.1038/nature10730 doi:10.1038/nature10730
  3. Love, M. I., Huber, W., & Anders, S. (2014). Moderated estimation of fold change and dispersion for RNA-seq data with DESeq2. Genome Biology, 15(12), 550. https://doi.org/10.1186/s13059-014-0550-8 doi:10.1186/s13059-014-0550-8
  4. Chen, Y., Chen, L., Lun, A. T. L., Baldoni, P. L., & Smyth, G. K. (2025). edgeR v4: powerful differential analysis of sequencing data with expanded functionality and improved support for small counts and larger datasets. Nucleic Acids Research, 53(2), gkaf018. https://doi.org/10.1093/nar/gkaf018 doi:10.1093/nar/gkaf018
catalog/diffbind →

Python library

Gene set enrichment (gseapy)

Gene set enrichment

Tests whether pathways are over-represented in a gene list, or enriched at the top or bottom of a ranked gene list (preranked GSEA).

Name
enrichment
Open-source program
gseapy gseapy 1.3.1
Replaces
Ingenuity Pathway Analysis (IPA), MetaCore
Trust label
Reviewed
Known-answer tests
6
Citations (4)
  1. Fang, Z., Liu, X., & Peltz, G. (2023). GSEApy: a comprehensive package for performing gene set enrichment analysis in Python. Bioinformatics, 39(1), btac757. doi:10.1093/bioinformatics/btac757
  2. Subramanian, A., Tamayo, P., Mootha, V. K., Mukherjee, S., Ebert, B. L., Gillette, M. A., Paulovich, A., Pomeroy, S. L., Golub, T. R., Lander, E. S., & Mesirov, J. P. (2005). Gene set enrichment analysis: a knowledge-based approach for interpreting genome-wide expression profiles. Proceedings of the National Academy of Sciences, 102(43), 15545-15550. doi:10.1073/pnas.0506580102
  3. Benjamini, Y., & Hochberg, Y. (1995). Controlling the false discovery rate: a practical and powerful approach to multiple testing. Journal of the Royal Statistical Society: Series B, 57(1), 289-300. doi:10.1111/j.2517-6161.1995.tb02031.x
  4. Kuleshov, M. V., Jones, M. R., Rouillard, A. D., Fernandez, N. F., Duan, Q., Wang, Z., Koplev, S., Jenkins, S. L., Jagodnik, K. M., Lachmann, A., McDermott, M. G., Monteiro, C. D., Gundersen, G. W., & Ma'ayan, A. (2016). Enrichr: a comprehensive gene set enrichment analysis web server 2016 update. Nucleic Acids Research, 44(W1), W90-W97. doi:10.1093/nar/gkw377
catalog/enrichment →

Command line

FastQC

Genomics: sequencing quality

Checks the quality of a sequencing read file with FastQC.

Name
fastqc
Open-source program
FastQC 0.13.0
Replaces
CLC Genomics Workbench (in part)
Trust label
Reviewed
Known-answer tests
4
Citations (1)
  1. Andrews, S. (2010). FastQC: A Quality Control Tool for High Throughput Sequence Data [Computer software]. Babraham Bioinformatics. https://www.bioinformatics.babraham.ac.uk/projects/fastqc/ www.bioinformatics.babraham.ac.uk/projects/fastqc/
catalog/fastqc →

Python library

Harmony integration of single-cell samples

Single-cell RNA sequencing: integration

Merges single-cell samples, removes the batch effect from the principal components with Harmony, and measures the mixing with LISI (local inverse Simpson index).

Name
harmony
Open-source program
harmonypy
Replaces
Partek Flow and Genomics Suite (in part), Loupe Browser (in part)
Trust label
Reviewed
Known-answer tests
13
Citations (4)
  1. Korsunsky, I., Millard, N., Fan, J., Slowikowski, K., Zhang, F., Wei, K., Baglaenko, Y., Brenner, M., Loh, P., & Raychaudhuri, S. (2019). Fast, sensitive and accurate integration of single-cell data with Harmony. Nature Methods, 16(12), 1289-1296. https://doi.org/10.1038/s41592-019-0619-0 doi:10.1038/s41592-019-0619-0
  2. Slowikowski, K. (2021). harmonypy: a data alignment algorithm. Zenodo. https://doi.org/10.5281/zenodo.4531400 doi:10.5281/zenodo.4531400
  3. Wolf, F. A., Angerer, P., & Theis, F. J. (2018). SCANPY: large-scale single-cell gene expression data analysis. Genome Biology, 19(1), 15. https://doi.org/10.1186/s13059-017-1382-0 doi:10.1186/s13059-017-1382-0
  4. McInnes, L., Healy, J., & Melville, J. (2018). UMAP: Uniform Manifold Approximation and Projection for Dimension Reduction. arXiv. https://doi.org/10.48550/arXiv.1802.03426 doi:10.48550/arXiv.1802.03426
catalog/harmony →

Script

MAGeCK (CRISPR screen hit calling from sgRNA counts)

Functional genomics: CRISPR screens

Finds the genes that a pooled CRISPR knockout screen selects for or against, from a table of sgRNA read counts, with MAGeCK.

Name
mageck
Open-source program
MAGeCK 0.5.9.5
Replaces
CRISPR screen analysis in vendor portals
Trust label
Reviewed
Known-answer tests
7
Citations (4)
  1. Li, W., Xu, H., Xiao, T., Cong, L., Love, M. I., Zhang, F., Irizarry, R. A., Liu, J. S., Brown, M., & Liu, X. S. (2014). MAGeCK enables robust identification of essential genes from genome-scale CRISPR/Cas9 knockout screens. Genome Biology, 15(12), 554. https://doi.org/10.1186/s13059-014-0554-4 doi:10.1186/s13059-014-0554-4
  2. Li, W., Köster, J., Xu, H., Chen, C.-H., Xiao, T., Liu, J. S., Brown, M., & Liu, X. S. (2015). Quality control, modeling, and visualization of CRISPR screens with MAGeCK-VISPR. Genome Biology, 16, 281. https://doi.org/10.1186/s13059-015-0843-6 doi:10.1186/s13059-015-0843-6
  3. Kolde, R., Laur, S., Adler, P., & Vilo, J. (2012). Robust rank aggregation for gene list integration and meta-analysis. Bioinformatics, 28(4), 573-580. https://doi.org/10.1093/bioinformatics/btr709 doi:10.1093/bioinformatics/btr709
  4. Benjamini, Y., & Hochberg, Y. (1995). Controlling the false discovery rate: a practical and powerful approach to multiple testing. Journal of the Royal Statistical Society B, 57(1), 289-300. https://doi.org/10.1111/j.2517-6161.1995.tb02031.x doi:10.1111/j.2517-6161.1995.tb02031.x
catalog/mageck →

Script

MendelianRandomization (causal effect from GWAS summary statistics)

Human genetics

Estimates the causal effect of an exposure on an outcome from summary statistics of genetic variants, with the R package MendelianRandomization.

Name
mendelianrandomization
Open-source program
MendelianRandomization 0.10.0
Replaces
Golden Helix SVS and other genetics suites
Trust label
Reviewed
Known-answer tests
9
Citations (6)
  1. Yavorska, O. O., & Burgess, S. (2017). MendelianRandomization: an R package for performing Mendelian randomization analyses using summarized data. International Journal of Epidemiology, 46(6), 1734-1739. https://doi.org/10.1093/ije/dyx034 doi:10.1093/ije/dyx034
  2. Broadbent, J. R., Foley, C. N., Grant, A. J., Mason, A. M., Staley, J. R., & Burgess, S. (2020). MendelianRandomization v0.5.0: updates to an R package for performing Mendelian randomization analyses using summarized data. Wellcome Open Research, 5, 252. https://doi.org/10.12688/wellcomeopenres.16374.2 doi:10.12688/wellcomeopenres.16374.2
  3. Burgess, S., Butterworth, A., & Thompson, S. G. (2013). Mendelian randomization analysis with multiple genetic variants using summarized data. Genetic Epidemiology, 37(7), 658-665. https://doi.org/10.1002/gepi.21758 doi:10.1002/gepi.21758
  4. Bowden, J., Davey Smith, G., & Burgess, S. (2015). Mendelian randomization with invalid instruments: effect estimation and bias detection through Egger regression. International Journal of Epidemiology, 44(2), 512-525. https://doi.org/10.1093/ije/dyv080 doi:10.1093/ije/dyv080
  5. Bowden, J., Davey Smith, G., Haycock, P. C., & Burgess, S. (2016). Consistent estimation in Mendelian randomization with some invalid instruments using a weighted median estimator. Genetic Epidemiology, 40(4), 304-314. https://doi.org/10.1002/gepi.21965 doi:10.1002/gepi.21965
  6. Hartwig, F. P., Davey Smith, G., & Bowden, J. (2017). Robust inference in summary data Mendelian randomization via the zero modal pleiotropy assumption. International Journal of Epidemiology, 46(6), 1985-1998. https://doi.org/10.1093/ije/dyx102 doi:10.1093/ije/dyx102
catalog/mendelianrandomization →

Python library

MOFA+ (multi-omics factor analysis)

Multi-omics integration

Finds the shared sources of variation in two or more omics tables of the same samples with MOFA+ (mofapy2).

Name
mofa
Open-source program
mofapy2 0.7.5
Replaces
SIMCA (in part)
Trust label
Reviewed
Known-answer tests
4
Citations (3)
  1. Argelaguet R, Arnol D, Bredikhin D, Deloro Y, Velten B, Marioni JC, Stegle O (2020). MOFA+: a statistical framework for comprehensive integration of multi-modal single-cell data. Genome Biology 21: 111. doi:10.1186/s13059-020-02015-1
  2. Argelaguet R, Velten B, Arnol D, Dietrich S, Zenz T, Marioni JC, Buettner F, Huber W, Stegle O (2018). Multi-Omics Factor Analysis: a framework for unsupervised integration of multi-omics data sets. Molecular Systems Biology 14: e8124. doi:10.15252/msb.20178124
  3. Benjamini Y, Hochberg Y (1995). Controlling the false discovery rate: a practical and powerful approach to multiple testing. Journal of the Royal Statistical Society B 57(1): 289-300. doi:10.1111/j.2517-6161.1995.tb02031.x
catalog/mofa →

Command line

samtools

Genomics: alignments

Converts, sorts, indexes and counts aligned sequencing reads with samtools.

Name
samtools
Open-source program
samtools 1.24
Replaces
CLC Genomics Workbench (in part)
Trust label
Reviewed
Known-answer tests
3
Citations (2)
  1. Danecek, P., Bonfield, J. K., Liddle, J., Marshall, J., Ohan, V., Pollard, M. O., Whitwham, A., Keane, T., McCarthy, S. A., Davies, R. M., & Li, H. (2021). Twelve years of SAMtools and BCFtools. GigaScience, 10(2), giab008. https://doi.org/10.1093/gigascience/giab008 doi:10.1093/gigascience/giab008
  2. Li, H., Handsaker, B., Wysoker, A., Fennell, T., Ruan, J., Homer, N., Marth, G., Abecasis, G., Durbin, R., & 1000 Genome Project Data Processing Subgroup. (2009). The Sequence Alignment/Map format and SAMtools. Bioinformatics, 25(16), 2078–2079. https://doi.org/10.1093/bioinformatics/btp352 doi:10.1093/bioinformatics/btp352
catalog/samtools →

Python library

Scanpy

Single-cell RNA sequencing

Clusters single-cell RNA data with scanpy.

Name
scanpy
Open-source program
scanpy
Replaces
Partek Flow and Genomics Suite (in part), Loupe Browser (in part)
Trust label
Reviewed
Known-answer tests
12
Citations (7)
  1. Wolf, F. A., Angerer, P., & Theis, F. J. (2018). SCANPY: large-scale single-cell gene expression data analysis. Genome Biology, 19(1), 15. https://doi.org/10.1186/s13059-017-1382-0 doi:10.1186/s13059-017-1382-0
  2. Virshup, I., Rybakov, S., Theis, F. J., Angerer, P., & Wolf, F. A. (2024). anndata: Access and store annotated data matrices. Journal of Open Source Software, 9(101), 4371. https://doi.org/10.21105/joss.04371 doi:10.21105/joss.04371
  3. Satija, R., Farrell, J. A., Gennert, D., Schier, A. F., & Regev, A. (2015). Spatial reconstruction of single-cell gene expression data. Nature Biotechnology, 33(5), 495–502. https://doi.org/10.1038/nbt.3192 doi:10.1038/nbt.3192
  4. Zheng, G. X. Y., Terry, J. M., Belgrader, P., Ryvkin, P., Bent, Z. W., Wilson, R., Ziraldo, S. B., Wheeler, T. D., McDermott, G. P., Zhu, J., Gregory, M. T., Shuga, J., Montesclaros, L., Underwood, J. G., Masquelier, D. A., Nishimura, S. Y., Schnall-Levin, M., Wyatt, P. W., Hindson, C. M., . . . Bielas, J. H. (2017). Massively parallel digital transcriptional profiling of single cells. Nature Communications, 8, 14049. https://doi.org/10.1038/ncomms14049 doi:10.1038/ncomms14049
  5. McInnes, L., Healy, J., & Melville, J. (2018). UMAP: Uniform Manifold Approximation and Projection for Dimension Reduction. arXiv. https://doi.org/10.48550/arXiv.1802.03426 doi:10.48550/arXiv.1802.03426
  6. Traag, V. A., Waltman, L., & van Eck, N. J. (2019). From Louvain to Leiden: guaranteeing well-connected communities. Scientific Reports, 9(1), 5233. https://doi.org/10.1038/s41598-019-41695-z doi:10.1038/s41598-019-41695-z
  7. Wilcoxon, F. (1945). Individual Comparisons by Ranking Methods. Biometrics Bulletin, 1(6), 80–83. https://doi.org/10.2307/3001968 doi:10.2307/3001968
catalog/scanpy →

Python library

Squidpy spatial statistics

Spatial transcriptomics

Analyzes spatial transcriptomics data (Visium spots or single cells with coordinates) with Squidpy.

Name
squidpy
Open-source program
squidpy
Replaces
Partek Flow and Genomics Suite (in part), Loupe Browser (in part)
Trust label
Reviewed
Known-answer tests
13
Citations (5)
  1. Palla, G., Spitzer, H., Klein, M., Fischer, D., Schaar, A. C., Kuemmerle, L. B., Rybakov, S., Ibarra, I. L., Holmberg, O., Virshup, I., Lotfollahi, M., Richter, S., & Theis, F. J. (2022). Squidpy: a scalable framework for spatial omics analysis. Nature Methods, 19(2), 171-178. https://doi.org/10.1038/s41592-021-01358-2 doi:10.1038/s41592-021-01358-2
  2. Wolf, F. A., Angerer, P., & Theis, F. J. (2018). SCANPY: large-scale single-cell gene expression data analysis. Genome Biology, 19(1), 15. https://doi.org/10.1186/s13059-017-1382-0 doi:10.1186/s13059-017-1382-0
  3. Moran, P. A. P. (1950). Notes on continuous stochastic phenomena. Biometrika, 37(1/2), 17-23. https://doi.org/10.2307/2332142 doi:10.2307/2332142
  4. Geary, R. C. (1954). The contiguity ratio and statistical mapping. The Incorporated Statistician, 5(3), 115-146. https://doi.org/10.2307/2986645 doi:10.2307/2986645
  5. Traag, V. A., Waltman, L., & van Eck, N. J. (2019). From Louvain to Leiden: guaranteeing well-connected communities. Scientific Reports, 9(1), 5233. https://doi.org/10.1038/s41598-019-41695-z doi:10.1038/s41598-019-41695-z
catalog/squidpy →
Fig. 5 | Phylogenetics. 1 adapters.

Phylogenetics

Align DNA or protein sequences and build evolutionary trees.

Command line

MAFFT and IQ-TREE

Aligns DNA or protein sequences with MAFFT and builds maximum-likelihood trees with IQ-TREE.

Name
phylo
Open-source program
IQ-TREE 3.1.4
Replaces
None in the program map
Trust label
Reviewed
Known-answer tests
6
Citations (5)
  1. Wong, T. K. F., Ly-Trong, N., Ren, H., Demotte, P., Baños, H., Roger, A. J., Susko, E., Bielow, C., De Maio, N., Goldman, N., Hahn, M. W., dos Reis, M., Vinh, L. S., Huttley, G., Lanfear, R., & Minh, B. Q. (2026). IQ-TREE 3: phylogenomic inference software using complex evolutionary models. Molecular Biology and Evolution, 43(5), msag117. https://doi.org/10.1093/molbev/msag117 doi:10.1093/molbev/msag117
  2. Katoh, K., & Standley, D. M. (2013). MAFFT Multiple Sequence Alignment Software Version 7: Improvements in Performance and Usability. Molecular Biology and Evolution, 30(4), 772–780. https://doi.org/10.1093/molbev/mst010 doi:10.1093/molbev/mst010
  3. Kalyaanamoorthy, S., Minh, B. Q., Wong, T. K. F., von Haeseler, A., & Jermiin, L. S. (2017). ModelFinder: fast model selection for accurate phylogenetic estimates. Nature Methods, 14(6), 587–589. https://doi.org/10.1038/nmeth.4285 doi:10.1038/nmeth.4285
  4. Hoang, D. T., Chernomor, O., von Haeseler, A., Minh, B. Q., & Vinh, L. S. (2018). UFBoot2: Improving the Ultrafast Bootstrap Approximation. Molecular Biology and Evolution, 35(2), 518–522. https://doi.org/10.1093/molbev/msx281 doi:10.1093/molbev/msx281
  5. Felsenstein, J. (1985). Confidence limits on phylogenies: an approach using the bootstrap. Evolution, 39(4), 783–791. https://doi.org/10.1111/j.1558-5646.1985.tb00420.x doi:10.1111/j.1558-5646.1985.tb00420.x
catalog/phylo →
Fig. 6 | Neuroscience. 2 adapters.

Neuroscience

Clean and analyze brain recordings from electroencephalography (EEG) and magnetoencephalography (MEG). Measure spikes and synaptic currents in patch-clamp recordings.

Python library

MNE-Python

Neuroscience: MEG and EEG

Analyzes EEG and MEG recordings with MNE-Python.

Name
mne
Open-source program
MNE-Python
Replaces
MATLAB (in part)
Trust label
Reviewed
Known-answer tests
11
Citations (5)
  1. Gramfort, A., Luessi, M., Larson, E., Engemann, D. A., Strohmeier, D., Brodbeck, C., Goj, R., Jas, M., Brooks, T., Parkkonen, L., & Hämäläinen, M. S. (2013). MEG and EEG data analysis with MNE-Python. Frontiers in Neuroscience, 7, 267. https://doi.org/10.3389/fnins.2013.00267 doi:10.3389/fnins.2013.00267
  2. Gramfort, A., Luessi, M., Larson, E., Engemann, D. A., Strohmeier, D., Brodbeck, C., Parkkonen, L., & Hämäläinen, M. S. (2014). MNE software for processing MEG and EEG data. NeuroImage, 86, 446–460. https://doi.org/10.1016/j.neuroimage.2013.10.027 doi:10.1016/j.neuroimage.2013.10.027
  3. Hyvärinen, A. (1999). Fast and robust fixed-point algorithms for independent component analysis. IEEE Transactions on Neural Networks, 10(3), 626–634. https://doi.org/10.1109/72.761722 doi:10.1109/72.761722
  4. Bell, A. J., & Sejnowski, T. J. (1995). An Information-Maximization Approach to Blind Separation and Blind Deconvolution. Neural Computation, 7(6), 1129–1159. https://doi.org/10.1162/neco.1995.7.6.1129 doi:10.1162/neco.1995.7.6.1129
  5. Ablin, P., Cardoso, J.-F., & Gramfort, A. (2018). Faster Independent Component Analysis by Preconditioning With Hessian Approximations. IEEE Transactions on Signal Processing, 66(15), 4040–4049. https://doi.org/10.1109/TSP.2018.2844203 doi:10.1109/TSP.2018.2844203
catalog/mne →

Python library

Patch clamp (pyABF, Neo and eFEL)

Electrophysiology: patch-clamp

Measures action potentials, passive properties, currents and spontaneous synaptic events from patch-clamp recordings.

Name
patch-clamp
Open-source program
pyABF with Neo and eFEL pyabf 2.3.8, neo 0.14.5, efel 5.7.34
Replaces
pCLAMP with Clampfit (in part), Easy Electrophysiology (in part), Igor Pro with NeuroMatic (in part), Mini Analysis (in part)
Trust label
Reviewed
Known-answer tests
19
Citations (15)
  1. Harden, S. W. (2017 to 2026). pyABF: a Python library for reading electrophysiology data from Axon Binary Format (ABF) files [Computer software]. swharden.com/pyabf/
  2. Garcia, S., Guarino, D., Jaillet, F., Jennings, T., Propper, R., Rautenberg, P. L., Rodgers, C. C., Sobolev, A., Wachtler, T., Yger, P., & Davison, A. P. (2014). Neo: an object model for handling electrophysiology data in multiple formats. Frontiers in Neuroinformatics, 8, 10. doi:10.3389/fninf.2014.00010
  3. Ranjan, R., Van Geit, W., Moor, R., Roessert, C., Riquelme, L., Damart, T., Jaquier, A., Tuncel, A., Mandge, D., Kilic, I., et al. (2020). eFEL: Electrophys Feature Extraction Library [Computer software]. Zenodo. doi:10.5281/zenodo.593869
  4. Sekerli, M., Del Negro, C. A., Lee, R. H., & Butera, R. J. (2004). Estimating action potential thresholds from neuronal time-series: new metrics and evaluation of methodologies. IEEE Transactions on Biomedical Engineering, 51(9), 1665-1672. doi:10.1109/TBME.2004.827531
  5. Gouwens, N. W., Sorensen, S. A., Berg, J., Lee, C., Jarsky, T., Ting, J., et al. (2019). Classification of electrophysiological and morphological neuron types in the mouse visual cortex. Nature Neuroscience, 22(7), 1182-1195. doi:10.1038/s41593-019-0417-0
  6. Neher, E. (1992). Correction for liquid junction potentials in patch clamp experiments. Methods in Enzymology, 207, 123-131. doi:10.1016/0076-6879(92)07008-C
  7. Bezanilla, F., & Armstrong, C. M. (1977). Inactivation of the sodium channel. I. Sodium current experiments. Journal of General Physiology, 70(5), 549-566. doi:10.1085/jgp.70.5.549
  8. Barry, P. H. (1994). JPCalc, a software package for calculating liquid junction potential corrections in patch-clamp, intracellular, epithelial and bilayer measurements and for correcting junction potential measurements. Journal of Neuroscience Methods, 51(1), 107-116. doi:10.1016/0165-0270(94)90031-0
  9. Hodgkin, A. L., & Huxley, A. F. (1952). A quantitative description of membrane current and its application to conduction and excitation in nerve. The Journal of Physiology, 117(4), 500-544. doi:10.1113/jphysiol.1952.sp004764
  10. Clements, J. D., & Bekkers, J. M. (1997). Detection of spontaneous synaptic events with an optimally scaled template. Biophysical Journal, 73(1), 220-229. doi:10.1016/S0006-3495(97)78062-7
  11. Welch, B. L. (1947). The generalization of 'Student's' problem when several different population variances are involved. Biometrika, 34(1-2), 28-35. doi:10.1093/biomet/34.1-2.28
  12. Mann, H. B., & Whitney, D. R. (1947). On a test of whether one of two random variables is stochastically larger than the other. The Annals of Mathematical Statistics, 18(1), 50-60. doi:10.1214/aoms/1177730491
  13. Benjamini, Y., & Hochberg, Y. (1995). Controlling the false discovery rate: a practical and powerful approach to multiple testing. Journal of the Royal Statistical Society: Series B, 57(1), 289-300. doi:10.1111/j.2517-6161.1995.tb02031.x
  14. Lazic, S. E. (2010). The problem of pseudoreplication in neuroscientific studies: is it affecting your analysis? BMC Neuroscience, 11, 5. doi:10.1186/1471-2202-11-5
  15. Aarts, E., Verhage, M., Veenvliet, J. V., Dolan, C. V., & van der Sluis, S. (2014). A solution to dependency: using multilevel analysis to accommodate nested data. Nature Neuroscience, 17(4), 491-496. doi:10.1038/nn.3648
catalog/patch-clamp →
Fig. 7 | Structural biology. 1 adapters.

Structural biology

Measure protein structures and the motion of molecules in a simulation.

Python library

MDAnalysis and Bio.PDB

Measures molecular dynamics trajectories with MDAnalysis (RMSD, RMSF, radius of gyration, contacts, hydrogen bonds) and structure files with Bio.PDB (residues per chain, distances, superposition).

Name
mdanalysis
Open-source program
MDAnalysis
Replaces
None in the program map
Trust label
Reviewed
Known-answer tests
11
Citations (7)
  1. Michaud-Agrawal, N., Denning, E. J., Woolf, T. B., & Beckstein, O. (2011). MDAnalysis: A toolkit for the analysis of molecular dynamics simulations. Journal of Computational Chemistry, 32(10), 2319–2327. https://doi.org/10.1002/jcc.21787 doi:10.1002/jcc.21787
  2. Gowers, R. J., Linke, M., Barnoud, J., Reddy, T. J. E., Melo, M. N., Seyler, S. L., Domański, J., Dotson, D. L., Buchoux, S., Kenney, I. M., & Beckstein, O. (2016). MDAnalysis: A Python Package for the Rapid Analysis of Molecular Dynamics Simulations. In Proceedings of the 15th Python in Science Conference (pp. 98–105). https://doi.org/10.25080/Majora-629e541a-00e doi:10.25080/Majora-629e541a-00e
  3. Theobald, D. L. (2005). Rapid calculation of RMSDs using a quaternion-based characteristic polynomial. Acta Crystallographica Section A: Foundations of Crystallography, 61(4), 478–480. https://doi.org/10.1107/S0108767305015266 doi:10.1107/S0108767305015266
  4. Liu, P., Agrafiotis, D. K., & Theobald, D. L. (2010). Fast determination of the optimal rotational matrix for macromolecular superpositions. Journal of Computational Chemistry, 31(7), 1561–1563. https://doi.org/10.1002/jcc.21439 doi:10.1002/jcc.21439
  5. Smith, P., Ziolek, R. M., Gazzarrini, E., Owen, D. M., & Lorenz, C. D. (2019). On the interaction of hyaluronic acid with synovial fluid lipid membranes. Physical Chemistry Chemical Physics, 21(19), 9845–9857. https://doi.org/10.1039/C9CP01532A doi:10.1039/C9CP01532A
  6. Cock, P. J. A., Antao, T., Chang, J. T., Chapman, B. A., Cox, C. J., Dalke, A., Friedberg, I., Hamelryck, T., Kauff, F., Wilczynski, B., & de Hoon, M. J. L. (2009). Biopython: freely available Python tools for computational molecular biology and bioinformatics. Bioinformatics, 25(11), 1422–1423. https://doi.org/10.1093/bioinformatics/btp163 doi:10.1093/bioinformatics/btp163
  7. Hamelryck, T., & Manderick, B. (2003). PDB file parser and structure class implemented in Python. Bioinformatics, 19(17), 2308–2310. https://doi.org/10.1093/bioinformatics/btg299 doi:10.1093/bioinformatics/btg299
catalog/mdanalysis →
Fig. 8 | Chemistry. 2 adapters.

Chemistry

Convert molecule files and calculate the properties of molecules.

Command line

Open Babel format conversion and descriptors

Converts molecule files between formats and writes descriptor values with Open Babel.

Name
openbabel
Open-source program
Open Babel 3.2.1
Replaces
None in the program map
Trust label
Reviewed
Known-answer tests
4
Citations (1)
  1. O'Boyle, N. M., Banck, M., James, C. A., Morley, C., Vandermeersch, T., & Hutchison, G. R. (2011). Open Babel: An open chemical toolbox. Journal of Cheminformatics, 3, 33. https://doi.org/10.1186/1758-2946-3-33 doi:10.1186/1758-2946-3-33
catalog/openbabel →

Python library

RDKit descriptors, rule of five and solubility model

Reads SMILES from a CSV file, computes descriptors, counts rule of five violations and fits or scores an ESOL solubility equation.

Name
rdkit
Open-source program
RDKit 2026.03.6
Replaces
None in the program map
Trust label
Reviewed
Known-answer tests
4
Citations (5)
  1. Landrum, G., et al. (2026). RDKit: Open-source cheminformatics (Version 2026.03.6) [Computer software]. Zenodo. https://doi.org/10.5281/zenodo.591637 doi:10.5281/zenodo.591637
  2. Wildman, S. A., & Crippen, G. M. (1999). Prediction of Physicochemical Parameters by Atomic Contributions. Journal of Chemical Information and Computer Sciences, 39(5), 868–873. https://doi.org/10.1021/ci990307l doi:10.1021/ci990307l
  3. Ertl, P., Rohde, B., & Selzer, P. (2000). Fast Calculation of Molecular Polar Surface Area as a Sum of Fragment-Based Contributions and Its Application to the Prediction of Drug Transport Properties. Journal of Medicinal Chemistry, 43(20), 3714–3717. https://doi.org/10.1021/jm000942e doi:10.1021/jm000942e
  4. Lipinski, C. A., Lombardo, F., Dominy, B. W., & Feeney, P. J. (1997). Experimental and computational approaches to estimate solubility and permeability in drug discovery and development settings. Advanced Drug Delivery Reviews, 23(1-3), 3–25. https://doi.org/10.1016/S0169-409X(96)00423-1 doi:10.1016/S0169-409X(96)00423-1
  5. Delaney, J. S. (2004). ESOL: Estimating Aqueous Solubility Directly from Molecular Structure. Journal of Chemical Information and Computer Sciences, 44(3), 1000–1005. https://doi.org/10.1021/ci034243x doi:10.1021/ci034243x
catalog/rdkit →
Fig. 9 | Microbiology. 3 adapters.

Microbiology

Read drug susceptibility tests, compare microbial communities and fit growth curves.

Script

AMR (antimicrobial resistance, MIC interpretation)

Susceptibility testing

Reads minimum inhibitory concentration (MIC) tables with the R package AMR.

Name
amr
Open-source program
AMR 3.0.1
Replaces
Vitek 2 and Sensititre software (in part), Excel for MIC50 and MIC90
Trust label
Reviewed
Known-answer tests
10
Citations (1)
  1. Berends MS, Luz CF, Friedrich AW, Sinha BNM, Albers CJ, Glasner C (2022). AMR: An R Package for Working with Antimicrobial Resistance Data. Journal of Statistical Software 104(3): 1-31. doi:10.18637/jss.v104.i03
catalog/amr →

Script

growthcurver (bacterial and cell growth curves)

Microbial growth curves

Fits a logistic growth curve to each well of a plate reader file with the R package growthcurver.

Name
growthcurver
Open-source program
growthcurver 0.3.1
Replaces
Gen5 (in part)
Trust label
Reviewed
Known-answer tests
7
Citations (4)
  1. Sprouffske K (2020). growthcurver: Simple Metrics to Summarize Growth Curves. R package version 0.3.1. doi:10.32614/CRAN.package.growthcurver
  2. Sprouffske K, Wagner A (2016). Growthcurver: an R package for obtaining interpretable metrics from microbial growth curves. BMC Bioinformatics 17: 172. doi:10.1186/s12859-016-1016-7
  3. Hall BG, Acar H, Nandipati A, Barlow M (2014). Growth rates made easy. Molecular Biology and Evolution 31(1): 232-238. doi:10.1093/molbev/mst187
  4. Petzoldt T (2025). growthrates: Estimate Growth Rates from Experimental Data. R package version 0.8.5. doi:10.32614/CRAN.package.growthrates
catalog/growthcurver →

Script

Microbiome feature tables (diversity, PERMANOVA, MaAsLin 2, ALDEx2)

Microbiome tables

Reads a 16S ASV or OTU table, or a shotgun species table, with a sample table.

Name
microbiome
Open-source program
MaAsLin2 1.26.0
Replaces
CLC Microbial Genomics Module (in part)
Trust label
Reviewed
Known-answer tests
16
Citations (10)
  1. Mallick, H., Rahnavard, A., McIver, L. J., Ma, S., Zhang, Y., Nguyen, L. H., Tickle, T. L., Weingart, G., Ren, B., Schwager, E. H., Chatterjee, S., Thompson, K. N., Wilkinson, J. E., Subramanian, A., Lu, Y., Waldron, L., Paulson, J. N., Franzosa, E. A., Bravo, H. C., & Huttenhower, C. (2021). Multivariable association discovery in population-scale meta-omics studies. PLOS Computational Biology, 17(11), e1009442. https://doi.org/10.1371/journal.pcbi.1009442 doi:10.1371/journal.pcbi.1009442
  2. Fernandes, A. D., Reid, J. N., Macklaim, J. M., McMurrough, T. A., Edgell, D. R., & Gloor, G. B. (2014). Unifying the analysis of high-throughput sequencing datasets: characterizing RNA-seq, 16S rRNA gene sequencing and selective growth experiments by compositional data analysis. Microbiome, 2, 15. https://doi.org/10.1186/2049-2618-2-15 doi:10.1186/2049-2618-2-15
  3. Oksanen, J., Simpson, G. L., Blanchet, F. G., Kindt, R., Legendre, P., Minchin, P. R., O'Hara, R. B., Solymos, P., Stevens, M. H. H., Szoecs, E., Wagner, H., et al. (2026). vegan: Community Ecology Package [Computer software]. https://doi.org/10.32614/CRAN.package.vegan doi:10.32614/CRAN.package.vegan
  4. Shannon, C. E. (1948). A Mathematical Theory of Communication. Bell System Technical Journal, 27(3), 379-423. https://doi.org/10.1002/j.1538-7305.1948.tb01338.x doi:10.1002/j.1538-7305.1948.tb01338.x
  5. Hurlbert, S. H. (1971). The Nonconcept of Species Diversity: A Critique and Alternative Parameters. Ecology, 52(4), 577-586. https://doi.org/10.2307/1934145 doi:10.2307/1934145
  6. Anderson, M. J. (2001). A new method for non-parametric multivariate analysis of variance. Austral Ecology, 26(1), 32-46. https://doi.org/10.1111/j.1442-9993.2001.01070.pp.x doi:10.1111/j.1442-9993.2001.01070.pp.x
  7. Anderson, M. J. (2006). Distance-based tests for homogeneity of multivariate dispersions. Biometrics, 62(1), 245-253. https://doi.org/10.1111/j.1541-0420.2005.00440.x doi:10.1111/j.1541-0420.2005.00440.x
  8. Aitchison, J. (1982). The Statistical Analysis of Compositional Data. Journal of the Royal Statistical Society B, 44(2), 139-160. https://doi.org/10.1111/j.2517-6161.1982.tb01195.x doi:10.1111/j.2517-6161.1982.tb01195.x
  9. Fernandes, A. D., Macklaim, J. M., Linn, T. G., Reid, G., & Gloor, G. B. (2013). ANOVA-like differential expression (ALDEx) analysis for mixed population RNA-seq. PLOS ONE, 8(7), e67019. https://doi.org/10.1371/journal.pone.0067019 doi:10.1371/journal.pone.0067019
  10. Benjamini, Y., & Hochberg, Y. (1995). Controlling the false discovery rate: a practical and powerful approach to multiple testing. Journal of the Royal Statistical Society B, 57(1), 289-300. https://doi.org/10.1111/j.2517-6161.1995.tb02031.x doi:10.1111/j.2517-6161.1995.tb02031.x
catalog/microbiome →
Fig. 10 | Bench assays. 4 adapters.

Bench assays

Fit standard curves, dose-response curves and qPCR data. Integrate chromatography peaks. Design primers and plan cloning.

Python library

Chromatogram peaks and calibration (hplc-py, SciPy)

Chromatography

Integrates peaks in a chromatogram that the scientist exported as a table, and fits a calibration curve.

Name
chromatography
Open-source program
hplc-py hplc-py 0.2.10, scipy 1.18.1
Replaces
Chromeleon CDS, Empower, OpenLab CDS
Trust label
Reviewed
Known-answer tests
6
Citations (2)
  1. Chure, G., & Cremer, J. (2024). hplc-py: A Python Utility For Rapid Quantification of Complex Chemical Chromatograms. Journal of Open Source Software, 9(94), 6270. doi:10.21105/joss.06270
  2. Virtanen, P., Gommers, R., Oliphant, T. E., Haberland, M., Reddy, T., Cournapeau, D., et al. (2020). SciPy 1.0: fundamental algorithms for scientific computing in Python. Nature Methods, 17(3), 261-272. doi:10.1038/s41592-019-0686-2
catalog/chromatography →

Python library

Sequences, primers and cloning (Biopython, primer3-py)

Molecular cloning

Reads SnapGene, GenBank, FASTA and ABI files, designs primers, gives melting temperatures, simulates PCR and restriction digests, and aligns Sanger reads to a reference.

Name
cloning
Open-source program
Biopython, primer3-py biopython 1.88, primer3-py 2.3.1
Replaces
SnapGene, Geneious Prime
Trust label
Reviewed
Known-answer tests
12
Citations (3)
  1. Cock, P. J. A., Antao, T., Chang, J. T., Chapman, B. A., Cox, C. J., Dalke, A., Friedberg, I., Hamelryck, T., Kauff, F., Wilczynski, B., & de Hoon, M. J. L. (2009). Biopython: freely available Python tools for computational molecular biology and bioinformatics. Bioinformatics, 25(11), 1422-1423. doi:10.1093/bioinformatics/btp163
  2. Untergasser, A., Cutcutache, I., Koressaar, T., Ye, J., Faircloth, B. C., Remm, M., & Rozen, S. G. (2012). Primer3: new capabilities and interfaces. Nucleic Acids Research, 40(15), e115. doi:10.1093/nar/gks596
  3. Koressaar, T., & Remm, M. (2007). Enhancements and modifications of primer design program Primer3. Bioinformatics, 23(10), 1289-1291. doi:10.1093/bioinformatics/btm091
catalog/cloning →

Script

drc (ELISA standard curves, dose-response, enzyme kinetics)

Plate assays: dose-response and ELISA

Fits ELISA standard curves, dose-response curves (IC50 and EC50) and enzyme kinetics with the R package drc.

Name
drc
Open-source program
drc 4.0.0
Replaces
Excel Solver and Analysis ToolPak (in part), SoftMax Pro (in part), Gen5 (in part)
Trust label
Reviewed
Known-answer tests
16
Citations (4)
  1. Ritz C, Jensen SM, Gerhard D, Streibig JC (2019). Dose-Response Analysis Using R. Chapman and Hall/CRC, New York. ISBN 9781315270098. doi:10.1201/b21966
  2. Ritz C, Baty F, Streibig JC, Gerhard D (2015). Dose-Response Analysis Using R. PLOS ONE 10(12): e0146021. doi:10.1371/journal.pone.0146021
  3. Gottschalk PG, Dunn JR (2005). The five-parameter logistic: a characterization and comparison with the four-parameter logistic. Analytical Biochemistry 343(1): 54-65. doi:10.1016/j.ab.2005.04.035
  4. Zhang JH, Chung TD, Oldenburg KR (1999). A simple statistical parameter for use in evaluation and validation of high throughput screening assays. Journal of Biomolecular Screening 4(2): 67-73. doi:10.1177/108705719900400206
catalog/drc →

Script

qPCR (NormqPCR, ddCt and Pfaffl)

qPCR gene expression

Ranks qPCR reference genes with geNorm and NormFinder from the R package NormqPCR.

Name
qpcr
Open-source program
NormqPCR 1.58.0
Replaces
CFX Maestro (in part), QuantStudio Design and Analysis (in part)
Trust label
Reviewed
Known-answer tests
9
Citations (6)
  1. Perkins JR, Dawes JM, McMahon SB, Bennett DLH, Orengo C, Kohl M (2012). ReadqPCR and NormqPCR: R packages for the reading, quality checking and normalisation of RT-qPCR quantification cycle (Cq) data. BMC Genomics 13: 296. doi:10.1186/1471-2164-13-296
  2. Vandesompele J, De Preter K, Pattyn F, Poppe B, Van Roy N, De Paepe A, Speleman F (2002). Accurate normalization of real-time quantitative RT-PCR data by geometric averaging of multiple internal control genes. Genome Biology 3(7): research0034. doi:10.1186/gb-2002-3-7-research0034
  3. Andersen CL, Jensen JL, Orntoft TF (2004). Normalization of real-time quantitative reverse transcription-PCR data: a model-based variance estimation approach to identify genes suited for normalization, applied to bladder and colon cancer data sets. Cancer Research 64(15): 5245-5250. doi:10.1158/0008-5472.CAN-04-0496
  4. Pfaffl MW (2001). A new mathematical model for relative quantification in real-time RT-PCR. Nucleic Acids Research 29(9): e45. doi:10.1093/nar/29.9.e45
  5. Livak KJ, Schmittgen TD (2001). Analysis of relative gene expression data using real-time quantitative PCR and the 2-ddCT method. Methods 25(4): 402-408. doi:10.1006/meth.2001.1262
  6. Welch BL (1947). The generalization of Student's problem when several different population variances are involved. Biometrika 34(1-2): 28-35. doi:10.1093/biomet/34.1-2.28
catalog/qpcr →
Fig. 11 | Statistics. 2 adapters.

Statistics

Run statistical tests, regression, mixed models and survival analysis on a data table.

Python library

Biostatistics (statsmodels, pingouin, lifelines)

Runs classical tests, ANOVA, regression, logistic regression, contingency table tests (chi-square, Fisher, McNemar), mixed models and survival analysis on a CSV file.

Name
biostats
Open-source program
statsmodels, pingouin, lifelines lifelines 0.30.3, statsmodels 0.15.0, pingouin 0.7.0, scipy 1.18.1, scikit-posthocs 0.17.0
Replaces
GraphPad Prism (in part), IBM SPSS Statistics (in part), SAS (in part), Stata (in part), Excel Solver and Analysis ToolPak (in part), REDCap
Trust label
Reviewed
Known-answer tests
35
Citations (25)
  1. Seabold, S., & Perktold, J. (2010). Statsmodels: Econometric and Statistical Modeling with Python. In Proceedings of the 9th Python in Science Conference (pp. 92–96). https://doi.org/10.25080/Majora-92bf1922-011 doi:10.25080/Majora-92bf1922-011
  2. Vallat, R. (2018). Pingouin: statistics in Python. Journal of Open Source Software, 3(31), 1026. https://doi.org/10.21105/joss.01026 doi:10.21105/joss.01026
  3. Davidson-Pilon, C. (2019). lifelines: survival analysis in Python. Journal of Open Source Software, 4(40), 1317. https://doi.org/10.21105/joss.01317 doi:10.21105/joss.01317
  4. Virtanen P, Gommers R, Oliphant TE, et al. SciPy 1.0: fundamental algorithms for scientific computing in Python. Nature Methods 17, 261-272 (2020). doi:10.1038/s41592-019-0686-2
  5. Welch, B. L. (1947). The Generalization of "Student's" Problem when Several Different Population Variances are Involved. Biometrika, 34(1-2), 28–35. https://doi.org/10.1093/biomet/34.1-2.28 doi:10.1093/biomet/34.1-2.28
  6. Wilcoxon, F. (1945). Individual Comparisons by Ranking Methods. Biometrics Bulletin, 1(6), 80–83. https://doi.org/10.2307/3001968 doi:10.2307/3001968
  7. Mann, H. B., & Whitney, D. R. (1947). On a Test of Whether one of Two Random Variables is Stochastically Larger than the Other. The Annals of Mathematical Statistics, 18(1), 50–60. https://doi.org/10.1214/aoms/1177730491 doi:10.1214/aoms/1177730491
  8. Welch, B. L. (1951). On the Comparison of Several Mean Values: An Alternative Approach. Biometrika, 38(3-4), 330–336. https://doi.org/10.1093/biomet/38.3-4.330 doi:10.1093/biomet/38.3-4.330
  9. Tukey, J. W. (1949). Comparing Individual Means in the Analysis of Variance. Biometrics, 5(2), 99–114. https://doi.org/10.2307/3001913 doi:10.2307/3001913
  10. Games, P. A., & Howell, J. F. (1976). Pairwise Multiple Comparison Procedures with Unequal N's and/or Variances: A Monte Carlo Study. Journal of Educational Statistics, 1(2), 113–125. https://doi.org/10.3102/10769986001002113 doi:10.3102/10769986001002113
  11. Holm, S. (1979). A Simple Sequentially Rejective Multiple Test Procedure. Scandinavian Journal of Statistics, 6(2), 65–70. https://www.jstor.org/stable/4615733 www.jstor.org/stable/4615733
  12. Benjamini, Y., & Hochberg, Y. (1995). Controlling the False Discovery Rate: A Practical and Powerful Approach to Multiple Testing. Journal of the Royal Statistical Society: Series B (Methodological), 57(1), 289–300. https://doi.org/10.1111/j.2517-6161.1995.tb02031.x doi:10.1111/j.2517-6161.1995.tb02031.x
  13. Benjamini, Y., & Yekutieli, D. (2001). The control of the false discovery rate in multiple testing under dependency. The Annals of Statistics, 29(4), 1165–1188. https://doi.org/10.1214/aos/1013699998 doi:10.1214/aos/1013699998
  14. MacKinnon, J. G., & White, H. (1985). Some heteroskedasticity-consistent covariance matrix estimators with improved finite sample properties. Journal of Econometrics, 29(3), 305–325. https://doi.org/10.1016/0304-4076(85)90158-7 doi:10.1016/0304-4076(85)90158-7
  15. Kaplan, E. L., & Meier, P. (1958). Nonparametric Estimation from Incomplete Observations. Journal of the American Statistical Association, 53(282), 457–481. https://doi.org/10.1080/01621459.1958.10501452 doi:10.1080/01621459.1958.10501452
  16. Cox, D. R. (1972). Regression Models and Life-Tables. Journal of the Royal Statistical Society: Series B (Methodological), 34(2), 187–202. https://doi.org/10.1111/j.2517-6161.1972.tb00899.x doi:10.1111/j.2517-6161.1972.tb00899.x
  17. Efron, B. (1977). The Efficiency of Cox's Likelihood Function for Censored Data. Journal of the American Statistical Association, 72(359), 557–565. https://doi.org/10.1080/01621459.1977.10480613 doi:10.1080/01621459.1977.10480613
  18. Breslow, N. (1974). Covariance Analysis of Censored Survival Data. Biometrics, 30(1), 89–99. https://doi.org/10.2307/2529620 doi:10.2307/2529620
  19. Grambsch, P. M., & Therneau, T. M. (1994). Proportional hazards tests and diagnostics based on weighted residuals. Biometrika, 81(3), 515–526. https://doi.org/10.1093/biomet/81.3.515 doi:10.1093/biomet/81.3.515
  20. Greenhouse, S. W., & Geisser, S. (1959). On methods in the analysis of profile data. Psychometrika, 24(2), 95-112. doi:10.1007/BF02289823
  21. Mauchly, J. W. (1940). Significance test for sphericity of a normal n-variate distribution. The Annals of Mathematical Statistics, 11(2), 204-209. doi:10.1214/aoms/1177731915
  22. Kruskal, W. H., & Wallis, W. A. (1952). Use of ranks in one-criterion variance analysis. Journal of the American Statistical Association, 47(260), 583-621. doi:10.1080/01621459.1952.10483441
  23. Dunn, O. J. (1964). Multiple comparisons using rank sums. Technometrics, 6(3), 241-252. doi:10.1080/00401706.1964.10490181
  24. Friedman, M. (1937). The use of ranks to avoid the assumption of normality implicit in the analysis of variance. Journal of the American Statistical Association, 32(200), 675-701. doi:10.1080/01621459.1937.10503522
  25. McNemar Q. Note on the sampling error of the difference between correlated proportions or percentages. Psychometrika 12(2), 153-157 (1947). doi:10.1007/BF02295996
catalog/biostats →

Script

lme4 (linear mixed models)

Statistics: mixed models

Fits linear mixed-effects models with lme4 and lmerTest in R.

Name
lme4
Open-source program
lme4 2.0.6
Replaces
SAS (in part)
Trust label
Reviewed
Known-answer tests
7
Citations (4)
  1. Bates, D., Mächler, M., Bolker, B., & Walker, S. (2015). Fitting Linear Mixed-Effects Models Using lme4. Journal of Statistical Software, 67(1), 1–48. https://doi.org/10.18637/jss.v067.i01 doi:10.18637/jss.v067.i01
  2. Kuznetsova, A., Brockhoff, P. B., & Christensen, R. H. B. (2017). lmerTest Package: Tests in Linear Mixed Effects Models. Journal of Statistical Software, 82(13), 1–26. https://doi.org/10.18637/jss.v082.i13 doi:10.18637/jss.v082.i13
  3. Satterthwaite, F. E. (1946). An Approximate Distribution of Estimates of Variance Components. Biometrics Bulletin, 2(6), 110–114. https://doi.org/10.2307/3002019 doi:10.2307/3002019
  4. Kenward, M. G., & Roger, J. H. (1997). Small Sample Inference for Fixed Effects from Restricted Maximum Likelihood. Biometrics, 53(3), 983–997. https://doi.org/10.2307/2533558 doi:10.2307/2533558
catalog/lme4 →
Fig. 12 | Clinical and epidemiology. 5 adapters.

Clinical and epidemiology

Calculate rates, trial endpoints, diagnostic accuracy, meta-analyses and sample sizes for clinical studies.

Script

epitools (rates, rate ratios, standardization, attributable risk)

Epidemiology

Computes incidence rates and proportions with exact confidence intervals, rate ratios, risk ratios, risk differences, attributable fractions and the number needed to treat.

Name
epi-rates
Open-source program
epitools 0.5.10.1
Replaces
Stata (in part), OpenEpi
Trust label
Reviewed
Known-answer tests
19
Citations (7)
  1. Aragon, T. J. (2020). epitools: Epidemiology Tools. R package version 0.5-10.1. https://doi.org/10.32614/CRAN.package.epitools doi:10.32614/CRAN.package.epitools
  2. Clopper, C. J., & Pearson, E. S. (1934). The use of confidence or fiducial limits illustrated in the case of the binomial. Biometrika, 26(4), 404-413. https://doi.org/10.1093/biomet/26.4.404 doi:10.1093/biomet/26.4.404
  3. Wilson, E. B. (1927). Probable inference, the law of succession, and statistical inference. Journal of the American Statistical Association, 22(158), 209-212. https://doi.org/10.1080/01621459.1927.10502953 doi:10.1080/01621459.1927.10502953
  4. Berry, G., & Armitage, P. (1995). Mid-P confidence intervals: a brief review. The Statistician, 44(4), 417-423. https://doi.org/10.2307/2348891 doi:10.2307/2348891
  5. Altman, D. G. (1998). Confidence intervals for the number needed to treat. BMJ, 317(7168), 1309-1312. https://doi.org/10.1136/bmj.317.7168.1309 doi:10.1136/bmj.317.7168.1309
  6. Levin, M. L. (1953). The occurrence of lung cancer in man. Acta Unio Internationalis Contra Cancrum, 9(3), 531-541. https://pubmed.ncbi.nlm.nih.gov/13124110/ pubmed.ncbi.nlm.nih.gov/13124110/
  7. Fay, M. P., & Feuer, E. J. (1997). Confidence intervals for directly standardized rates: a method based on the gamma distribution. Statistics in Medicine, 16(7), 791-801. https://doi.org/10.1002/(sici)1097-0258(19970415)16:7<791::aid-sim500>3.0.co;2-# doi:10.1002/(sici)1097-0258(19970415)16:7<791::aid-sim500>3.0.co;2-#
catalog/epi-rates →

Script

metafor (meta-analysis)

Meta-analysis

Pools the results of several studies with metafor in R.

Name
metafor
Open-source program
metafor 5.2.1
Replaces
Stata (in part)
Trust label
Reviewed
Known-answer tests
8
Citations (4)
  1. Viechtbauer W. Conducting meta-analyses in R with the metafor package. Journal of Statistical Software 36(3), 1-48 (2010). doi:10.18637/jss.v036.i03
  2. DerSimonian R, Laird N. Meta-analysis in clinical trials. Controlled Clinical Trials 7(3), 177-188 (1986). doi:10.1016/0197-2456(86)90046-2
  3. Higgins JPT, Thompson SG. Quantifying heterogeneity in a meta-analysis. Statistics in Medicine 21(11), 1539-1558 (2002). doi:10.1002/sim.1186
  4. Egger M, Davey Smith G, Schneider M, Minder C. Bias in meta-analysis detected by a simple, graphical test. BMJ 315(7109), 629-634 (1997). doi:10.1136/bmj.315.7109.629
catalog/metafor →

Script

pROC (diagnostic accuracy and ROC curves)

Diagnostic accuracy

Measures how well a test or a marker finds a disease, with pROC in R.

Name
proc
Open-source program
pROC 1.19.1
Replaces
None in the program map
Trust label
Reviewed
Known-answer tests
7
Citations (4)
  1. Robin X, Turck N, Hainard A, Tiberti N, Lisacek F, Sanchez J-C, Müller M. pROC: an open-source package for R and S+ to analyze and compare ROC curves. BMC Bioinformatics 12, 77 (2011). doi:10.1186/1471-2105-12-77
  2. DeLong ER, DeLong DM, Clarke-Pearson DL. Comparing the areas under two or more correlated receiver operating characteristic curves: a nonparametric approach. Biometrics 44(3), 837-845 (1988). doi:10.2307/2531595
  3. Youden WJ. Index for rating diagnostic tests. Cancer 3(1), 32-35 (1950). doi:10.1002/1097-0142(1950)3:1<32::AID-CNCR2820030106>3.0.CO;2-3
  4. Clopper CJ, Pearson ES. The use of confidence or fiducial limits illustrated in the case of the binomial. Biometrika 26(4), 404-413 (1934). doi:10.1093/biomet/26.4.404
catalog/proc →

Script

pwr (power and sample size)

Power and sample size

Computes the sample size, the power or the detectable effect size of a planned study with pwr in R.

Name
pwr
Open-source program
pwr 1.3.0
Replaces
G*Power (in part)
Trust label
Reviewed
Known-answer tests
8
Citations (3)
  1. Champely S. pwr: Basic Functions for Power Analysis. R package version 1.3-0 (2020). doi:10.32614/CRAN.package.pwr
  2. Cohen J. Statistical Power Analysis for the Behavioral Sciences, 2nd edition. Lawrence Erlbaum Associates, Hillsdale NJ (1988). doi:10.4324/9780203771587
  3. Fleiss JL, Tytun A, Ury HK. A simple approximation for calculating sample sizes for comparing independent proportions. Biometrics 36(2), 343-346 (1980). doi:10.2307/2529990
catalog/pwr →

Script

Clinical trial endpoints (risk difference, stratified analysis, restricted mean survival time, non-inferiority)

Clinical trial statistics

Analyzes the primary endpoint of a two-arm trial from a table of patients or from event counts.

Name
trial-endpoints
Open-source program
survRM2 1.0-4
Replaces
SAS (in part), Stata (in part)
Trust label
Reviewed
Known-answer tests
17
Citations (11)
  1. Uno, H., Tian, L., Horiguchi, M., Cronin, A., Battioui, C., & Bell, J. (2022). survRM2: Comparing Restricted Mean Survival Time. R package version 1.0-4. https://doi.org/10.32614/CRAN.package.survRM2 doi:10.32614/CRAN.package.survRM2
  2. Uno, H., Claggett, B., Tian, L., Inoue, E., Gallo, P., Miyata, T., Schrag, D., Takeuchi, M., Uyama, Y., Zhao, L., Skali, H., Solomon, S., Jacobus, S., Hughes, M., Packer, M., & Wei, L.-J. (2014). Moving beyond the hazard ratio in quantifying the between-group difference in survival analysis. Journal of Clinical Oncology, 32(22), 2380-2385. https://doi.org/10.1200/JCO.2014.55.2208 doi:10.1200/JCO.2014.55.2208
  3. Miettinen, O., & Nurminen, M. (1985). Comparative analysis of two rates. Statistics in Medicine, 4(2), 213-226. https://doi.org/10.1002/sim.4780040211 doi:10.1002/sim.4780040211
  4. Newcombe, R. G. (1998). Interval estimation for the difference between independent proportions: comparison of eleven methods. Statistics in Medicine, 17(8), 873-890. https://doi.org/10.1002/(SICI)1097-0258(19980430)17:8<873::AID-SIM779>3.0.CO;2-I doi:10.1002/(SICI)1097-0258(19980430)17:8<873::AID-SIM779>3.0.CO;2-I
  5. Altman, D. G. (1998). Confidence intervals for the number needed to treat. BMJ, 317(7168), 1309-1312. https://doi.org/10.1136/bmj.317.7168.1309 doi:10.1136/bmj.317.7168.1309
  6. Mantel, N., & Haenszel, W. (1959). Statistical aspects of the analysis of data from retrospective studies of disease. Journal of the National Cancer Institute, 22(4), 719-748. https://doi.org/10.1093/jnci/22.4.719 doi:10.1093/jnci/22.4.719
  7. Greenland, S., & Robins, J. M. (1985). Estimation of a common effect parameter from sparse follow-up data. Biometrics, 41(1), 55-68. https://doi.org/10.2307/2530643 doi:10.2307/2530643
  8. Robins, J., Breslow, N., & Greenland, S. (1986). Estimators of the Mantel-Haenszel variance consistent in both sparse data and large-strata limiting models. Biometrics, 42(2), 311-323. https://doi.org/10.2307/2531052 doi:10.2307/2531052
  9. Tarone, R. E. (1985). On heterogeneity tests based on efficient scores. Biometrika, 72(1), 91-95. https://doi.org/10.1093/biomet/72.1.91 doi:10.1093/biomet/72.1.91
  10. Cox, D. R. (1972). Regression models and life-tables. Journal of the Royal Statistical Society: Series B, 34(2), 187-202. https://doi.org/10.1111/j.2517-6161.1972.tb00899.x doi:10.1111/j.2517-6161.1972.tb00899.x
  11. Royston, P., & Parmar, M. K. B. (2013). Restricted mean survival time: an alternative to the hazard ratio for the design and analysis of randomized trials with a time-to-event outcome. BMC Medical Research Methodology, 13, 152. https://doi.org/10.1186/1471-2288-13-152 doi:10.1186/1471-2288-13-152
catalog/trial-endpoints →
Fig. 13 | Ecology. 1 adapters.

Ecology

Compare communities of species and relate them to the environment.

Script

vegan (community ecology)

Describes and tests plant or animal communities with vegan in R.

Name
vegan
Open-source program
vegan 2.7.6
Replaces
None in the program map
Trust label
Reviewed
Known-answer tests
10
Citations (9)
  1. Oksanen, J., Simpson, G. L., Blanchet, F. G., Kindt, R., Legendre, P., Minchin, P. R., O'Hara, R. B., Solymos, P., Stevens, M. H. H., Szoecs, E., Wagner, H., et al. (2026). vegan: Community Ecology Package [Computer software]. https://doi.org/10.32614/CRAN.package.vegan doi:10.32614/CRAN.package.vegan
  2. Shannon, C. E. (1948). A Mathematical Theory of Communication. Bell System Technical Journal, 27(3), 379–423. https://doi.org/10.1002/j.1538-7305.1948.tb01338.x doi:10.1002/j.1538-7305.1948.tb01338.x
  3. Simpson, E. H. (1949). Measurement of Diversity. Nature, 163(4148), 688. https://doi.org/10.1038/163688a0 doi:10.1038/163688a0
  4. Pielou, E. C. (1966). The measurement of diversity in different types of biological collections. Journal of Theoretical Biology, 13, 131–144. https://doi.org/10.1016/0022-5193(66)90013-0 doi:10.1016/0022-5193(66)90013-0
  5. Hurlbert, S. H. (1971). The Nonconcept of Species Diversity: A Critique and Alternative Parameters. Ecology, 52(4), 577–586. https://doi.org/10.2307/1934145 doi:10.2307/1934145
  6. Kruskal, J. B. (1964). Multidimensional Scaling by Optimizing Goodness of Fit to a Nonmetric Hypothesis. Psychometrika, 29(1), 1–27. https://doi.org/10.1007/BF02289565 doi:10.1007/BF02289565
  7. Legendre, P., & Gallagher, E. D. (2001). Ecologically meaningful transformations for ordination of species data. Oecologia, 129(2), 271–280. https://doi.org/10.1007/s004420100716 doi:10.1007/s004420100716
  8. Anderson, M. J. (2001). A new method for non-parametric multivariate analysis of variance. Austral Ecology, 26(1), 32–46. https://doi.org/10.1111/j.1442-9993.2001.01070.pp.x doi:10.1111/j.1442-9993.2001.01070.pp.x
  9. Anderson, M. J. (2006). Distance-Based Tests for Homogeneity of Multivariate Dispersions. Biometrics, 62(1), 245–253. https://doi.org/10.1111/j.1541-0420.2005.00440.x doi:10.1111/j.1541-0420.2005.00440.x
catalog/vegan →
Fig. 14 | Astronomy. 1 adapters.

Astronomy

Measure the brightness of stars and other sources in telescope images.

Python library

Astropy and photutils

Reads a FITS image, measures the background, finds sources and measures aperture fluxes with astropy and photutils.

Name
astropy
Open-source program
astropy and photutils astropy 8.0.1, photutils 3.0.0, numpy 2.5.3, scipy 1.18.1
Replaces
None in the program map
Trust label
Reviewed
Known-answer tests
10
Citations (5)
  1. Astropy Collaboration, Price-Whelan, A. M., Lim, P. L., Earl, N., Starkman, N., Bradley, L., Shupe, D. L., Patil, A. A., et al. (2022). The Astropy Project: Sustaining and Growing a Community-oriented Open-source Project and the Latest Major Release (v5.0) of the Core Package. The Astrophysical Journal, 935(2), 167. https://doi.org/10.3847/1538-4357/ac7c74 doi:10.3847/1538-4357/ac7c74
  2. Astropy Collaboration, Price-Whelan, A. M., Sipőcz, B. M., Günther, H. M., Lim, P. L., Crawford, S. M., Conseil, S., Shupe, D. L., et al. (2018). The Astropy Project: Building an Open-science Project and Status of the v2.0 Core Package. The Astronomical Journal, 156(3), 123. https://doi.org/10.3847/1538-3881/aabc4f doi:10.3847/1538-3881/aabc4f
  3. Astropy Collaboration, Robitaille, T. P., Tollerud, E. J., Greenfield, P., Droettboom, M., Bray, E., Aldcroft, T., Davis, M., et al. (2013). Astropy: A community Python package for astronomy. Astronomy & Astrophysics, 558, A33. https://doi.org/10.1051/0004-6361/201322068 doi:10.1051/0004-6361/201322068
  4. Bradley, L., Sipőcz, B. M., Robitaille, T. P., Tollerud, E. J., Vinícius, Z., Deil, C., et al. (2026). Photutils (Version 3.0.0) [Computer software]. Zenodo. https://doi.org/10.5281/zenodo.596036 doi:10.5281/zenodo.596036
  5. Bertin, E., & Arnouts, S. (1996). SExtractor: Software for source extraction. Astronomy and Astrophysics Supplement Series, 117(2), 393–404. https://doi.org/10.1051/aas:1996164 doi:10.1051/aas:1996164
catalog/astropy →
Fig. 15 | Geospatial. 2 adapters.

Geospatial

Read and convert maps and satellite images, and measure areas on them.

Command line

GDAL and OGR

Reads, reprojects and measures raster and vector map data with the GDAL and OGR command line programs, and takes zonal statistics with rasterstats.

Name
gdal
Open-source program
GDAL 3.13.3
Replaces
None in the program map
Trust label
Reviewed
Known-answer tests
11
Citations (1)
  1. GDAL/OGR contributors. (2026). GDAL/OGR Geospatial Data Abstraction software Library (Version 3.13.3) [Computer software]. Open Source Geospatial Foundation. https://doi.org/10.5281/zenodo.5884351 doi:10.5281/zenodo.5884351
catalog/gdal →

Command line

QGIS Processing

Runs QGIS Processing algorithms from the command line with qgis_process.

Name
qgis
Open-source program
QGIS 4.2.3
Replaces
None in the program map
Trust label
Reviewed
Known-answer tests
5
Citations (2)
  1. QGIS.org. (2026). QGIS Geographic Information System (Version 4.2.3) [Computer software]. QGIS Association. https://doi.org/10.5281/zenodo.6139224 doi:10.5281/zenodo.6139224
  2. Graser, A., Sutton, T., & Bernasocchi, M. (2025). The QGIS project: Spatial without compromise. Patterns, 6(7), 101265. https://doi.org/10.1016/j.patter.2025.101265 doi:10.1016/j.patter.2025.101265
catalog/qgis →
Fig. 16 | Any program. 2 adapters.

Any program

These adapters are not for one field. The onboarding adapter writes a draft adapter for a new program. The tables adapter reads and writes lab sheets.

MCP server

Onboarding a new program

Any: builds new adapters

Finds a program, reads its help and docs, and writes an adapter folder for it.

Name
onboarding
Open-source program
Onboarding tools
Replaces
None in the program map
Trust label
Reviewed
Known-answer tests
3
Citations (1)
  1. Smith, P. (2026). Cuvette (Version 0.1.0) [Computer software]. https://cuvette.ai cuvette.ai
catalog/onboarding →

Python library

Tables, Excel and figures (pandas, openpyxl, matplotlib)

Tables and figures

Reads CSV and Excel lab sheets, summarizes and reshapes tables, writes xlsx files and makes journal-style plots.

Name
tables
Open-source program
pandas, openpyxl, matplotlib pandas 2.3.3, openpyxl 3.1.5, matplotlib 3.11.2
Replaces
GraphPad Prism (in part), Excel Solver and Analysis ToolPak (in part), REDCap
Trust label
Reviewed
Known-answer tests
6
Citations (2)
  1. McKinney, W. (2010). Data Structures for Statistical Computing in Python. In Proceedings of the 9th Python in Science Conference (pp. 56–61). https://doi.org/10.25080/Majora-92bf1922-00a doi:10.25080/Majora-92bf1922-00a
  2. Hunter, J. D. (2007). Matplotlib: A 2D Graphics Environment. Computing in Science & Engineering, 9(3), 90–95. https://doi.org/10.1109/MCSE.2007.55 doi:10.1109/MCSE.2007.55
catalog/tables →

Build your own

Your program is not in the list? Add it.

The catalog is the set of adapters that comes with Cuvette. You can write a new adapter by hand, or the model can write a draft for you. Each adapter stays a draft until you approve it. Type the commands below in a terminal.

Make a new adapter

The model finds the program, reads its help and its documentation, and writes a draft.

  1. Start the onboarding. This step writes a draft adapter.
    cuvette onboard <program> --model claude
  2. Check the draft and run its known-answer tests.
    cuvette adapter check <folder> --run-tests
  3. Read each part. Then approve the adapter.
    cuvette adapter approve <folder> --by "Your Name"

Use a catalog adapter

Read the adapter folder on GitHub before you use it. Then approve it with your name.

  1. Approve the adapter.
    cuvette adapter approve imagej --by "Your Name"
  2. Start a session with it.
    cuvette --adapter imagej --model claude

Abbreviations in the adapter cards: ABI, the file format of Applied Biosystems Sanger sequencing traces. AMR, antimicrobial resistance. ANOVA, analysis of variance. ASV, amplicon sequence variant. ATAC-seq, assay for transposase-accessible chromatin with sequencing. CDS, chromatography data system. ChIP-seq, chromatin immunoprecipitation with sequencing. CRISPR, clustered regularly interspaced short palindromic repeats. CSV, comma-separated values, a table saved as text. DNA, deoxyribonucleic acid. EC50, the concentration that gives half of the maximum effect. EEG, electroencephalography. ELISA, enzyme-linked immunosorbent assay. ESOL, estimated solubility. FCS, Flow Cytometry Standard file. FDR, false discovery rate. FITS, Flexible Image Transport System, an astronomy image format. GDAL, Geospatial Data Abstraction Library. imzML and mzML, open file formats for mass spectrometry data. GSEA, gene set enrichment analysis. GWAS, genome-wide association study. IC50, the concentration that gives half of the maximum inhibition. IHC, immunohistochemistry. IPA, Ingenuity Pathway Analysis. LC-MS, liquid chromatography with mass spectrometry. LISI, local inverse Simpson index. m/z, mass-to-charge ratio. MALDI, matrix-assisted laser desorption/ionization. MEG, magnetoencephalography. MFI, median fluorescence intensity. MIC, minimum inhibitory concentration. MIC50 and MIC90 are the MIC values that stop 50% and 90% of the isolates. MOFA, multi-omics factor analysis. MS2, tandem mass spectrometry. MSI, mass spectrometry imaging. OGR, the vector part of GDAL. OME-TIFF, Open Microscopy Environment Tagged Image File Format. OTU, operational taxonomic unit. PCR, polymerase chain reaction. qPCR, quantitative PCR. PDB, Protein Data Bank. PERMANOVA, permutational multivariate analysis of variance. PNG, Portable Network Graphics, an image format. PSM, peptide-spectrum match. RMSD, root-mean-square deviation. RMSF, root-mean-square fluctuation. RNA, ribonucleic acid. RNA-seq, RNA sequencing. ROC, receiver operating characteristic. sgRNA, single guide RNA. SMILES, Simplified Molecular Input Line Entry System, a text format for molecules. TOPP, The OpenMS Proteomics Pipeline. VCF, Variant Call Format.

The version on a card is the program version that the adapter author used.
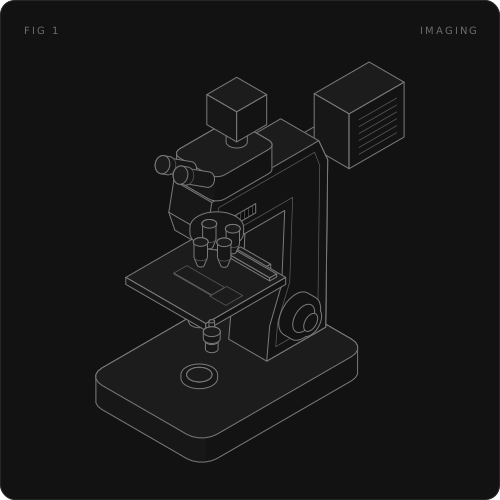
Adapters from others

Add your own adapter

An adapter that someone else wrote installs with one command. Cuvette checks the files before it installs them. The public registry does not exist yet. It is coming after the launch. See community adapters for the full steps.

Install an adapter

The source can be a git address, a folder or a .zip file.

  1. Add the adapter.
    cuvette adapter add <git address | folder | .zip>
  2. Wait for the check. Cuvette runs cuvette adapter check --static. This check imports no code. Cuvette does not install an adapter that has an error.
  3. Read the card. The card shows the program, the code that the adapter ships, the network use, the decisions, the license, the citations and the check result. Type y to install.

Cuvette pins a git source to a commit. It saves the source and a SHA-256 (Secure Hash Algorithm, 256 bits) checksum of the files. cuvette adapter list --installed shows an adapter whose files changed after the install. cuvette adapter update and cuvette adapter remove change or delete it.

Trust labels

Each adapter has one label. The label shows in cuvette adapters, on the Programs page, in the choice of program and in the session record.

Reviewed
The adapter is in the catalog on this page. The owner read every file.
Checked
The adapter came from the registry. It passed its automatic checks, and a person approved it.
Unlisted
The adapter came from a git address, a folder or a .zip file. Nobody reviewed it. Cuvette shows a warning. If the adapter ships code, Cuvette asks once more the first time that it runs.

The Claude review

Each submission to the registry gets a Claude review before a maintainer merges it. Claude reads the files as data and runs no code. It checks the adapter against the checklist, the licenses and the citations, and it posts a verdict. A maintainer still approves the merge.

You can run the same review on your own computer: cuvette adapter audit <folder | name>. The command asks first, because it sends the files to the Anthropic application programming interface (API) and costs tokens. The review is advice. It does not replace reading the code.

The registry

The registry is a public list of adapters that passed the checks. It does not exist yet. It is coming after the launch. Until then, share an adapter as a git repository or a .zip file.

Pick a program. The session record keeps each decision.