Validation / Papers / Sriphoosanaphan 2021
Sriphoosanaphan 2021: vitamin D and liver fibrosis markers after hepatitis C cure, a randomized trial
How to read this page
In this validation, a script plays the scientist. It gives the answers that we wrote before the run, from the methods of the paper. The run is one sample: another run can give different steps and numbers. The model is the AI. The harness is Cuvette, the software around the model: it runs the programs and records each step. A tool call is a request from the model to run one program step. The session record is the log of each message and each step. The claim check is a script that finds each number of the final answer in the step results. The review is a set of fixed rule checks plus a second AI model, the referee, that reads the record. A deviation is a request from the model for a setting that differs from the choice of the scientist. Each Claude model did 3 runs of this paper. This page shows run 3 of each Claude model and the one run of qwen3:8b. The table of values says how many of the Claude runs match.
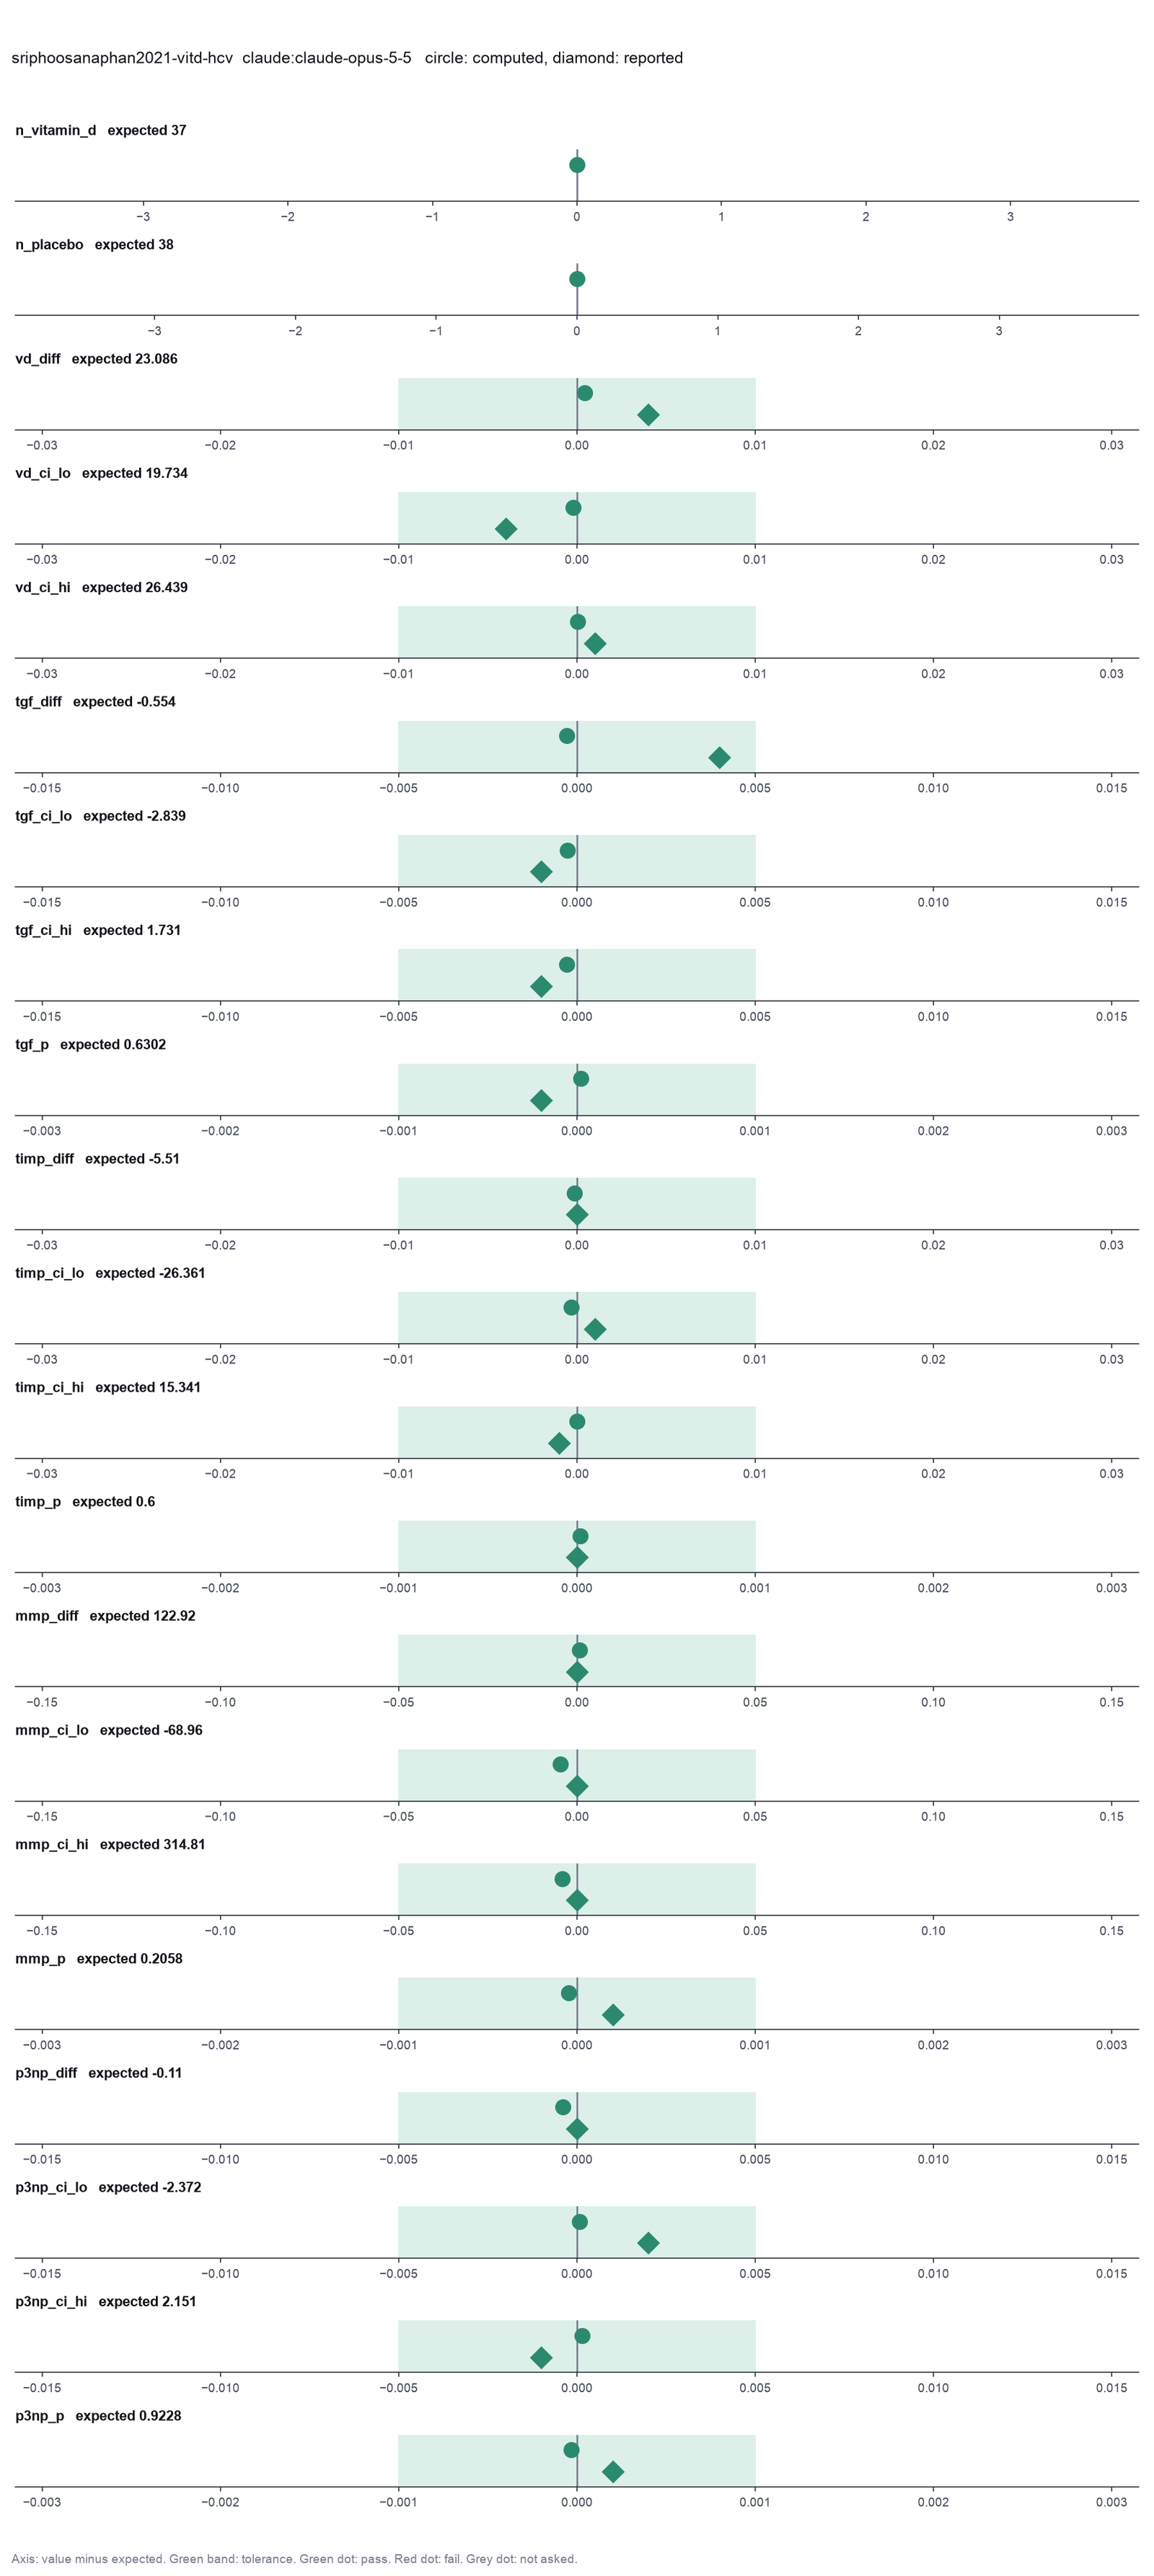
Opus: 21 of 21 values match, 19 of 19 correct in the final answer. All 3 runs: 21 of 21 values match. Sonnet: 21 of 21 values match, 19 of 19 correct in the final answer. All 3 runs: 21 of 21 values match. Haiku: 21 of 21 values match, 19 of 19 correct in the final answer. All 3 runs: 21 of 21 values match. qwen3:8b: 5 of 21 values match, 3 of 19 correct in the final answer.
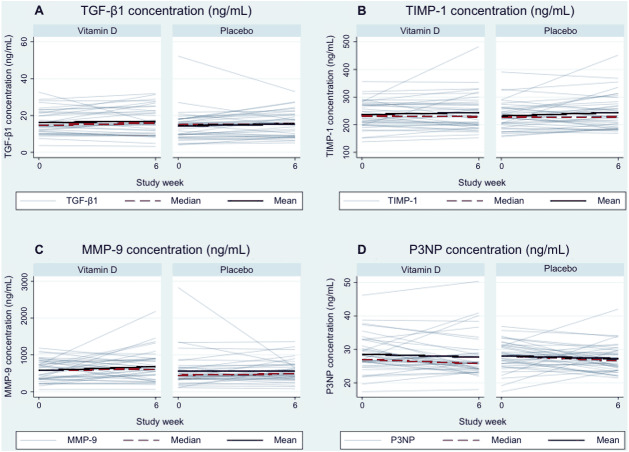
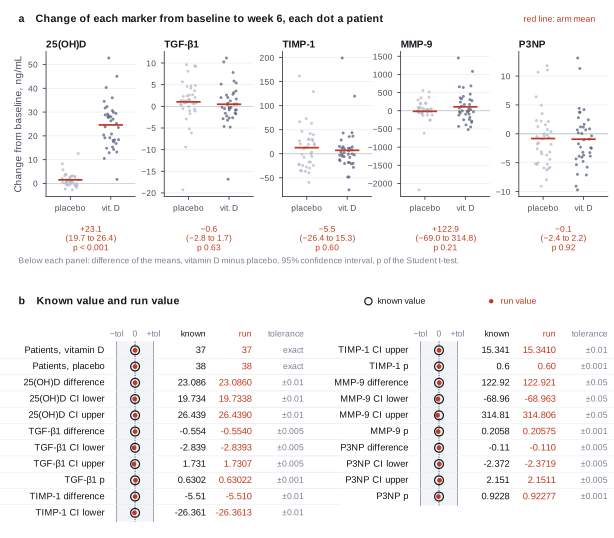
The figure in the paper and in the run
As published
Reproduced in Cuvette
The paper
Sriphoosanaphan S, Thanapirom K, Kerr SJ, Suksawatamnuay S, Thaimai P, Sittisomwong S, Sonsiri K, Srisoonthorn N, Teeratorn N, Tanpowpong N, Chaopathomkul B, Treeprasertsuk S, Poovorawan Y, Komolmit P. Effect of vitamin D supplementation in patients with chronic hepatitis C after direct-acting antiviral treatment: a randomized, double-blind, placebo-controlled trial. PeerJ 9:e10709 (2021). doi:10.7717/peerj.10709
Related sources:
- Data: Komolmit P. Effect of vitamin D supplementation in patients with chronic hepatitis C after direct-acting antiviral treatment. Dryad (2020), CC0. We download the copy on Zenodo, record 4404285. doi:10.5061/dryad.573n5tb4h
- Thai Clinical Trials Registry TCTR20171206003.
What it measured
The trial randomized 75 patients with chronic hepatitis C, a sustained virological response after direct-acting antivirals, liver fibrosis and a serum 25(OH)D below 30 ng/mL. 37 patients got ergocalciferol and 38 got placebo for 6 weeks. The trial measured serum 25(OH)D and four markers of liver fibrogenesis (TGF-beta1, TIMP-1, MMP-9 and P3NP) at baseline and at week 6. The primary analysis compares the change from baseline between the arms with an independent t-test.
Data
Dryad dataset 10.5061/dryad.573n5tb4h, copied on Zenodo record 4404285. fetch.sh converts the Excel sheet to one CSV file. It renames the column Group to arm (A is vitamin_d, B is placebo) and adds the columns VD_change, AST_change, ALT_change, TGF_change, TIMP_change, MMP_change and P3NP_change (week 6 minus baseline), because compare_two_groups reads one outcome column. The readme does not name the arms. The group sizes, the sex counts and the means of each group match Tables 2 and 3 of the paper.. Size: 20 KB Excel file, 75 rows and 24 columns. The CSV has 75 rows and 31 columns..
License: CC0 1.0 public domain dedication, from the Dryad and Zenodo records. The file has a case number, sex and an age range for each patient, and no names. The paper is CC BY 4.0.
The instruction
A script sent this message as the scientist. The file paths point to the fetched data.
The same request in the words of the paper's method:
Did vitamin D raise 25(OH)D, and did it change the four fibrosis markers compared with placebo? For each, give the difference in the mean change from baseline, vitamin D minus placebo, with a 95% confidence interval and a p-value.
Basis: The Statistical analysis section and Table 3. The paper reports the mean difference in the change from baseline to week 6, vitamin D against placebo, with a 95% confidence interval and a p-value from the independent t-test.
Results
Match: a number in the session record is inside the tolerance of the known value. In the final answer: the model also stated the value in its final answer. For a Claude model, each cell shows the run that this page shows. If the three runs differ, the cell also says in how many runs the value matches.
| Value | Known value | Tolerance | Opus | Sonnet | Haiku | qwen3:8b |
|---|---|---|---|---|---|---|
n_vitamin_dPatients in the vitamin D armSource of the known valuePrinted in the paperAbstract and Table 2. 37 patients in the vitamin D arm. | 37 | exact | 37 matchNot asked in the questionLog: n1 inspect_table file:{work}/inspect_table-1/columns.csv, entry 11 | 37 matchNot asked in the questionLog: n1 inspect_table file:{work}/inspect_table-1/columns.csv, entry 9 | 37 matchNot asked in the questionLog: n2 run_script stdout, entry 38 | 37 matchNot asked in the questionLog: n2 compare_two_groups metrics.n_b, entry 29 |
n_placeboPatients in the placebo armSource of the known valuePrinted in the paperAbstract and Table 2. 38 patients in the placebo arm. | 38 | exact | 38 matchNot asked in the questionLog: n2 compare_two_groups metrics.n_a, entry 54 | 38 matchNot asked in the questionLog: n2 compare_two_groups metrics.n_a, entry 36 | 38 matchNot asked in the questionLog: n2 run_script stdout, entry 38 | 38 matchNot asked in the questionLog: n2 compare_two_groups metrics.n_a, entry 29 |
vd_diff25(OH)D change, vitamin D minus placebo, ng/mLSource of the known valuePrinted in the paperChanges in VD levels section and Table 3. 23.1 ng/mL. | 23.086 | ± 0.01 | 23.08642 matchIn the final answer: yes (23.09)Log: n2 compare_two_groups metrics.mean_diff, entry 54; the final answer, entry 123 | 23.08642 matchIn the final answer: yes (23.09)Log: n2 compare_two_groups metrics.mean_diff, entry 36; the final answer, entry 94 | 23.08642 matchIn the final answer: yes (23.09)Log: n3 compare_two_groups metrics.mean_diff, entry 60; the final answer, entry 134 | 23.08642 matchIn the final answer: yes (23.09)Log: n2 compare_two_groups metrics.mean_diff, entry 29; the final answer, entry 44 |
vd_ci_lo25(OH)D, 95% CI lower boundSource of the known valuePrinted in the paperTable 3. 19.7. | 19.734 | ± 0.01 | 19.73379 matchIn the final answer: yes (19.73)Log: n2 compare_two_groups metrics.ci_lo, entry 54; the final answer, entry 123 | 19.73379 matchIn the final answer: yes (19.73)Log: n2 compare_two_groups metrics.ci_lo, entry 36; the final answer, entry 94 | 19.73379 matchIn the final answer: yes (19.73)Log: n3 compare_two_groups metrics.ci_lo, entry 60; the final answer, entry 134 | 19.73379 matchIn the final answer: yes (19.73)Log: n2 compare_two_groups metrics.ci_lo, entry 29; the final answer, entry 44 |
vd_ci_hi25(OH)D, 95% CI upper boundSource of the known valuePrinted in the paperTable 3. 26.4. | 26.439 | ± 0.01 | 26.43904 matchIn the final answer: yes (26.44)Log: n2 compare_two_groups metrics.ci_hi, entry 54; the final answer, entry 123 | 26.43904 matchIn the final answer: yes (26.44)Log: n2 compare_two_groups metrics.ci_hi, entry 36; the final answer, entry 94 | 26.43904 matchIn the final answer: yes (26.44)Log: n3 compare_two_groups metrics.ci_hi, entry 60; the final answer, entry 134 | 26.43904 matchIn the final answer: yes (26.44)Log: n2 compare_two_groups metrics.ci_hi, entry 29; the final answer, entry 44 |
tgf_diffTGF-beta1 change, vitamin D minus placebo, ng/mLSource of the known valuePrinted in the paperAbstract and Table 3. -0.6 ng/mL. | -0.554 | ± 0.005 | -0.5542817 matchIn the final answer: yes (-0.55)Log: n3 compare_two_groups metrics.mean_diff, entry 62; the final answer, entry 123 | -0.5542817 matchIn the final answer: yes (-0.55)Log: n3 compare_two_groups metrics.mean_diff, entry 39; the final answer, entry 94 | -0.5542817 matchIn the final answer: yes (-0.55)Log: n4 compare_two_groups metrics.mean_diff, entry 63; the final answer, entry 134 | 0 no matchIn the final answer: no (6.62e-22)Log: n1 inspect_table table.rows[0][2], entry 9; the final answer, entry 44 |
tgf_ci_loTGF-beta1, 95% CI lower boundSource of the known valuePrinted in the paperAbstract and Table 3. -2.8. | -2.839 | ± 0.005 | -2.839268 matchIn the final answer: yes (-2.84)Log: n3 compare_two_groups metrics.ci_lo, entry 62; the final answer, entry 123 | -2.839268 matchIn the final answer: yes (-2.84)Log: n3 compare_two_groups metrics.ci_lo, entry 39; the final answer, entry 94 | -2.839268 matchIn the final answer: yes (-2.84)Log: n4 compare_two_groups metrics.ci_lo, entry 63; the final answer, entry 134 | 0 no matchIn the final answer: no (6.62e-22)Log: n1 inspect_table table.rows[0][2], entry 9; the final answer, entry 44 |
tgf_ci_hiTGF-beta1, 95% CI upper boundSource of the known valuePrinted in the paperAbstract and Table 3. 1.7. | 1.731 | ± 0.005 | 1.730704 matchIn the final answer: yes (1.73)Log: n3 compare_two_groups metrics.ci_hi, entry 62; the final answer, entry 123 | 1.730704 matchIn the final answer: yes (1.73)Log: n3 compare_two_groups metrics.ci_hi, entry 39; the final answer, entry 94 | 1.730704 matchIn the final answer: yes (1.73)Log: n4 compare_two_groups metrics.ci_hi, entry 63; the final answer, entry 134 | 1.497368 no matchIn the final answer: no (6.62e-22)Log: n2 compare_two_groups metrics.mean_a, entry 29; the final answer, entry 44 |
tgf_pTGF-beta1, pSource of the known valuePrinted in the paperAbstract and Table 3. 0.63. | 0.6302 | ± 0.001 | 0.6302216 matchIn the final answer: yes (0.63)Log: n3 compare_two_groups metrics.p_value, entry 62; the final answer, entry 123 | 0.6302216 matchIn the final answer: yes (0.63)Log: n3 compare_two_groups metrics.p_value, entry 39; the final answer, entry 94 | 0.6302216 matchIn the final answer: yes (0.63)Log: n4 compare_two_groups metrics.p_value, entry 63; the final answer, entry 134 | 0.64 no matchIn the final answer: no (6.62e-22)Log: n1 inspect_table table.rows[7][4], entry 9; the final answer, entry 44 |
timp_diffTIMP-1 change, vitamin D minus placebo, ng/mLSource of the known valuePrinted in the paperAbstract and Table 3. -5.5 ng/mL. | -5.51 | ± 0.01 | -5.510156 matchIn the final answer: yes (-5.51)Log: n4 compare_two_groups metrics.mean_diff, entry 65; the final answer, entry 123 | -5.510156 matchIn the final answer: yes (-5.51)Log: n4 compare_two_groups metrics.mean_diff, entry 42; the final answer, entry 94 | -5.510156 matchIn the final answer: yes (-5.51)Log: n5 compare_two_groups metrics.mean_diff, entry 66; the final answer, entry 134 | 0 no matchIn the final answer: no (6.62e-22)Log: n1 inspect_table table.rows[0][2], entry 9; the final answer, entry 44 |
timp_ci_loTIMP-1, 95% CI lower boundSource of the known valuePrinted in the paperAbstract and Table 3. -26.4. | -26.361 | ± 0.01 | -26.36133 matchIn the final answer: yes (-26.36)Log: n4 compare_two_groups metrics.ci_lo, entry 65; the final answer, entry 123 | -26.36133 matchIn the final answer: yes (-26.36)Log: n4 compare_two_groups metrics.ci_lo, entry 42; the final answer, entry 94 | -26.36133 matchIn the final answer: yes (-26.36)Log: n5 compare_two_groups metrics.ci_lo, entry 66; the final answer, entry 134 | 0 no matchIn the final answer: no (6.62e-22)Log: n1 inspect_table table.rows[0][2], entry 9; the final answer, entry 44 |
timp_ci_hiTIMP-1, 95% CI upper boundSource of the known valuePrinted in the paperAbstract and Table 3. 15.3. | 15.341 | ± 0.01 | 15.34101 matchIn the final answer: yes (15.34)Log: n4 compare_two_groups metrics.ci_hi, entry 65; the final answer, entry 123 | 15.34101 matchIn the final answer: yes (15.34)Log: n4 compare_two_groups metrics.ci_hi, entry 42; the final answer, entry 94 | 15.34101 matchIn the final answer: yes (15.34)Log: n5 compare_two_groups metrics.ci_hi, entry 66; the final answer, entry 134 | 16.38 no matchIn the final answer: no (19.73)Log: n1 inspect_table table.rows[6][4], entry 9; the final answer, entry 44 |
timp_pTIMP-1, pSource of the known valuePrinted in the paperAbstract and Table 3. 0.60. | 0.6 | ± 0.001 | 0.6000182 matchIn the final answer: yes (0.6)Log: n4 compare_two_groups metrics.p_value, entry 65; the final answer, entry 123 | 0.6000182 matchIn the final answer: yes (0.6)Log: n4 compare_two_groups metrics.p_value, entry 42; the final answer, entry 94 | 0.6000182 matchIn the final answer: yes (0.6)Log: n5 compare_two_groups metrics.p_value, entry 66; the final answer, entry 134 | 0.64 no matchIn the final answer: no (6.62e-22)Log: n1 inspect_table table.rows[7][4], entry 9; the final answer, entry 44 |
mmp_diffMMP-9 change, vitamin D minus placebo, ng/mLSource of the known valuePrinted in the paperAbstract and Table 3. 122.9 ng/mL. | 122.92 | ± 0.05 | 122.9206 matchIn the final answer: yes (122.92)Log: n5 compare_two_groups metrics.mean_diff, entry 68; the final answer, entry 123 | 122.9206 matchIn the final answer: yes (122.92)Log: n5 compare_two_groups metrics.mean_diff, entry 45; the final answer, entry 94 | 122.9206 matchIn the final answer: yes (122.92)Log: n6 compare_two_groups metrics.mean_diff, entry 69; the final answer, entry 134 | 103 no matchIn the final answer: no (26.44)Log: n1 inspect_table table.rows[4][5], entry 9; the final answer, entry 44 |
mmp_ci_loMMP-9, 95% CI lower boundSource of the known valuePrinted in the paperAbstract and Table 3. -69.0. | -68.96 | ± 0.05 | -68.96466 matchIn the final answer: yes (-68.96)Log: n5 compare_two_groups metrics.ci_lo, entry 68; the final answer, entry 123 | -68.96466 matchIn the final answer: yes (-68.96)Log: n5 compare_two_groups metrics.ci_lo, entry 45; the final answer, entry 94 | -68.96466 matchIn the final answer: yes (-68.96)Log: n6 compare_two_groups metrics.ci_lo, entry 69; the final answer, entry 134 | 0 no matchIn the final answer: no (6.62e-22)Log: n1 inspect_table table.rows[0][2], entry 9; the final answer, entry 44 |
mmp_ci_hiMMP-9, 95% CI upper boundSource of the known valuePrinted in the paperAbstract and Table 3. 314.8. | 314.81 | ± 0.05 | 314.8059 matchIn the final answer: yes (314.81)Log: n5 compare_two_groups metrics.ci_hi, entry 68; the final answer, entry 123 | 314.8059 matchIn the final answer: yes (314.81)Log: n5 compare_two_groups metrics.ci_hi, entry 45; the final answer, entry 94 | 314.8059 matchIn the final answer: yes (314.81)Log: n6 compare_two_groups metrics.ci_hi, entry 69; the final answer, entry 134 | 357 no matchIn the final answer: no (26.44)Log: n1 inspect_table table.rows[12][5], entry 9; the final answer, entry 44 |
mmp_pMMP-9, pSource of the known valuePrinted in the paperAbstract and Table 3. 0.21. | 0.2058 | ± 0.001 | 0.2057536 matchIn the final answer: yes (0.206)Log: n5 compare_two_groups metrics.p_value, entry 68; the final answer, entry 123 | 0.2057536 matchIn the final answer: yes (0.206)Log: n5 compare_two_groups metrics.p_value, entry 45; the final answer, entry 94 | 0.2057536 matchIn the final answer: yes (0.206)Log: n6 compare_two_groups metrics.p_value, entry 69; the final answer, entry 134 | 0.14 no matchIn the final answer: no (6.62e-22)Log: n1 inspect_table table.rows[8][4], entry 9; the final answer, entry 44 |
p3np_diffP3NP change, vitamin D minus placebo, ng/mLSource of the known valuePrinted in the paperAbstract and Table 3. -0.1 ng/mL. | -0.11 | ± 0.005 | -0.1103912 matchIn the final answer: yes (-0.11)Log: n6 compare_two_groups metrics.mean_diff, entry 71; the final answer, entry 123 | -0.1103912 matchIn the final answer: yes (-0.11)Log: n6 compare_two_groups metrics.mean_diff, entry 48; the final answer, entry 94 | -0.1103912 matchIn the final answer: yes (-0.11)Log: n7 compare_two_groups metrics.mean_diff, entry 72; the final answer, entry 134 | 0 no matchIn the final answer: no (6.62e-22)Log: n1 inspect_table table.rows[0][2], entry 9; the final answer, entry 44 |
p3np_ci_loP3NP, 95% CI lower boundSource of the known valuePrinted in the paperAbstract and Table 3. -2.4. | -2.372 | ± 0.005 | -2.371921 matchIn the final answer: yes (-2.37)Log: n6 compare_two_groups metrics.ci_lo, entry 71; the final answer, entry 123 | -2.371921 matchIn the final answer: yes (-2.37)Log: n6 compare_two_groups metrics.ci_lo, entry 48; the final answer, entry 94 | -2.371921 matchIn the final answer: yes (-2.37)Log: n7 compare_two_groups metrics.ci_lo, entry 72; the final answer, entry 134 | 0 no matchIn the final answer: no (6.62e-22)Log: n1 inspect_table table.rows[0][2], entry 9; the final answer, entry 44 |
p3np_ci_hiP3NP, 95% CI upper boundSource of the known valuePrinted in the paperAbstract and Table 3. 2.2. | 2.151 | ± 0.005 | 2.151139 matchIn the final answer: yes (2.15)Log: n6 compare_two_groups metrics.ci_hi, entry 71; the final answer, entry 123 | 2.151139 matchIn the final answer: yes (2.15)Log: n6 compare_two_groups metrics.ci_hi, entry 48; the final answer, entry 94 | 2.151139 matchIn the final answer: yes (2.15)Log: n7 compare_two_groups metrics.ci_hi, entry 72; the final answer, entry 134 | 2 no matchIn the final answer: no (6.62e-22)Log: n1 inspect_table table.rows[1][3], entry 9; the final answer, entry 44 |
p3np_pP3NP, pSource of the known valuePrinted in the paperAbstract and Table 3. 0.92. | 0.9228 | ± 0.001 | 0.9227679 matchIn the final answer: yes (0.923)Log: n6 compare_two_groups metrics.p_value, entry 71; the final answer, entry 123 | 0.9227679 matchIn the final answer: yes (0.923)Log: n6 compare_two_groups metrics.p_value, entry 48; the final answer, entry 94 | 0.9227679 matchIn the final answer: yes (0.923)Log: n7 compare_two_groups metrics.p_value, entry 72; the final answer, entry 134 | 1 no matchIn the final answer: no (6.62e-22)Log: n1 inspect_table table.rows[0][4], entry 9; the final answer, entry 44 |
Session records
Session record, Opus, run 3 of 3
Every message, decision, step and result of this run, one JSON object for each log entry.
Session record, Sonnet, run 3 of 3
Every message, decision, step and result of this run, one JSON object for each log entry.
Session record, Haiku, run 3 of 3
Every message, decision, step and result of this run, one JSON object for each log entry.
Session record, qwen3:8b
Every message, decision, step and result of this run, one JSON object for each log entry.
Opus · claude-opus-5-5 · run 3 of 3 shown 21 of 21 values match, 19 of 19 correct in the final answer
The session
This is the session as the scientist sees it, in order. Decision cards show the answer that the script gave and where that answer comes from. Each step shows the program, its version, the input file hash and the outputs. Click a line to see more.
setup The decision record starts with these values. A script set them before the first message, from the answers that we wrote before the run.
- Unit of replication: subjects, patients or animals (one value per subject)Where the answer comes from: Patient characteristics section. Each of the 75 randomized patients gives one change for each marker.
- Significance level: 0.05Where the answer comes from: Sample size calculation section. The trial used a two-sided significance level of 5%.
harness note A note from the harness to the model. The scientist did not write it.
- Setup values:
Design:
- What is the unit of replication? (replicate): subjects, patients or animals (one value per subject)
Inference:
- Significance level (alpha) (alpha): 0.05
Ask the scientist: Paired test (paired), Test family for two groups (two_group_test), Assume equal variances (unpaired t-test) (equal_variance), Sidedness (alternative), ANOVA variance assumption (anova_variance), Pairwise comparisons after ANOVA (posthoc), Correction for a list of p-values (p_adjust_method), Model formula (model_formula), Standard errors for the linear model (standard_errors), Random effects of the mixed model (random_effects), Fit by REML (reml), Covariates of the Cox model (cox_covariates), Ties method of the Cox model (ties), Strata of the Cox model (cox_strata), Type of sums of squares (ss_type), Comparisons of the cell means after a factorial ANOVA (factorial_posthoc), Sphericity correction for repeated measures (sphericity_correction), Correction after a rank test over many groups (rank_p_adjust), Exact or approximate p value for a rank test (exact_p), Covariates of the logistic model (logistic_covariates), Outcome value that counts as the event (logistic_event), Reference level of each categorical covariate (reference_levels), Yates continuity correction for a 2x2 chi-square test (chi_square_correction), Sidedness of the Fisher exact test (fisher_alternative), Method of the McNemar test (mcnemar_method).
The harness fills these values into your tool calls automatically. If you give a different value, the harness logs a deviation and shows it to the scientist.
- Mode is now watch: you run the steps.
Model thinking, summary: I'll start by inspecting the table, then run a comparison on each change column by treatment arm. Since "placebo" sorts before "vitamin_d" alphabetically, the difference will be computed as vitamin_d minus placebo.
Model
I will first inspect the table to check the columns, the group sizes and the missing values.
inspect_table (adapter biostats).step n1 inspect_table adapter biostats 0.2.0, statsmodels, pingouin, lifelines 0.30.3
75 rows x 31 columns.
Input file: {data}/sriphoosanaphan2021-vitd-hcv/vitd_hcv.csv SHA-256 0a0861006d85.
Outputs: columns.csv (e9df16101f7e).
Arguments
| path | {data}/sriphoosanaphan2021-vitd-hcv/vitd_hcv.csv |
Tool output
{
 "ok": true,
 "summary": "75 rows x 31 columns.",
 "metrics": {
  "n_rows": 75,
  "n_columns": 31
 },
 "table": {
  "columns": [
   "column",
   "dtype",
   "n_missing",
   "n_unique",
   "min",
   "max",
   "first_values"
  ],
  "rows": [
   [
    "Case",
    "int64",
    0,
    75,
    1,
    75,
    "1, 2, 3, 4, 5"
   ],
   [
    "arm",
    "object",
    0,
    2,
    null,
    null,
    "vitamin_d, placebo"
   ],
   [
    "Sex",
    "int64",
    0,
    2,
    1,
    2,
    "2, 1"
   ],
   [
    "Age",
    "object",
    0,
    5,
    null,
    null,
    "61-70, 51-60, 71-80, 31-40, 41-50"
   ],
   [
    "BW",
    "float64",
    0,
    58,
    42,
    103,
    "53.5, 73.0, 62.3, 79.0, 75.7"
   ],
   [
    "Height",
    "int64",
    0,
    26,
    144,
    178,
    "160, 161, 153, 169, 178"
   ],
   [
    "BMI",
    "float64",
    0,
    74,
    16.38,
    36.22,
    "20.9, 28.16, 26.61, 27.66, 23.89"
   ],
   [
    "FIB4",
    "float64",
    0,
    72,
    0.64,
    12.56,
    "2.96, 0.98, 7.29, 0.94, 10.42"
   ],
   [
    "APRI",
    "float64",
    0,
    50,
    0.14,
    2.73,
    "0.45, 0.24, 1.35, 0.17, 2.54"
   ],
   [
    "VD0",
    "float64",
    0,
    62,
    8.3,
    24.2,
    "21.7, 11.3, 13.8, 18.3, 12.1"
   ],
   [
    "AST0",
    "int64",
    0,
    34,
    13,
    103,
    "26, 24, 42, 13, 64"
   ],
   [
    "ALT0",
    "float64",
    0,
    35,
    5,
    49,
    "18.0, 26.0, 14.0, 32.0, 7.0"
   ],
   [
    "Plt0",
    "int64",
    0,
    64,
    43,
    357,
    "143, 250, 78, 195, 63"
   ],
   [
    "VD6",
    "float64",
    0,
    71,
    7.8,
    64.3,
    "38.5, 40.1, 15.1, 16.6, 53.2"
   ],
   [
    "AST6",
    "int64",
    0,
    35,
    10,
    100,
    "42, 24, 43, 15, 40"
   ]
  ],
  "n_rows": 31,
  "path": "{work}/inspect_table-1/columns.csv"
 }
}compare-two-groups.Model thinking, summary: This missing min/max is probably just about string columns like arm or id in the summary table, not an actual data issue. I should check columns.csv directly to confirm which values are missing.
Model
The harness check looked at the column summary, not at the patient data. I will read the column summary to see the real missing values.
read_file.Result of read_file: Read 1894 of 1894 bytes from {work}/inspect_table-1/columns.csv.
column,dtype,n_missing,n_unique,min,max,first_values
Case,int64,0,75,1.0,75.0,"1, 2, 3, 4, 5"
arm,object,0,2,,,"vitamin_d, placebo"
Sex,int64,0,2,1.0,2.0,"2, 1"
Age,object,0,5,,,"61-70, 51-60, 71-80, 31-40, 41-50"
BW,float64,0,58,42.0,103.0,"53.5, 73.0, 62.3, 79.0, 75.7"
Height,int64,0,26,144.0,178.0,"160, 161, 153, 169, 178"
BMI,float64,0,74,16.38,36.22,"20.9, 28.16, 26.61, 27.66, 23.89"
FIB4,float64,0,72,0.64,12.56,"2.96, 0.98, 7.29, 0.94, 10.42"
APRI,float64,0,50,0.14,2.73,"0.45, 0.24, 1.35, 0.17, 2.54"
VD0,float64,0,62,8.3,24.2,"21.7, 11.3, 13.8, 18.3, 12.1"
AST0,int64,0,34,13.0,103.0,"26, 24, 42, 13, 64"
ALT0,float64,0,35,5.0,49.0,"18.0, 26.0, 14.0, 32.0, 7.0"
Plt0,int64,0,64,43.0,357.0,"143, 250, 78, 195, 63"
VD6,float64,0,71,7.8,64.3,"38.5, 40.1, 15.1, 16.6, 53.2"
AST6,int64,0,35,10.0,100.0,"42, 24, 43, 15, 40"
ALT6,int64,0,35,5.0,66.0,"37, 25, 28, 19, 32"
TGF0,float64,0,69,3.74,52.28,"12.62, 23.12, 7.16, 17.85, 7.63"
TGF6,float64,0,73,3.2,32.99,"16.16, 25.13, 7.77, 27.05, 6.53"
TIMP0,float64,0,74,138.22,390.82,"232.03, 212.85, 234.67, 229.39, 327.94"
TIMP6,float64,0,74,152.4,482.42,"246.63, 256.03, 210.27, 232.91, 298.16"
MMP0,float64,0,73,60.09,2827.85,"223.86, 802.05, 111.7, 1183.67, 334.03"
MMP6,float64,0,75,63.93,2183.48,"198.79, 877.07, 83.19, 1145.98, 363.75"
P3NP0,float64,0,69,17.32,46.14,"37.75, 29.83, 27.78, 26.87, 25.07"
P3NP6,float64,0,68,17.99,50.33,"32.97, 25.49, 29.34, 21.87, 25.81"
VD_change,float64,0,63,-2.7,52.7,"16.8, 28.8, 1.3, -1.7, 3.0"
AST_change,int64,0,25,-24.0,44.0,"16, 0, 1, 2, -24"
ALT_change,float64,0,28,-20.0,49.0,"19.0, -1.0, 2.0, 5.0, 0.0"
TGF_change,float64,0,73,-19.29,11.15,"3.54, 2.01, 0.61, 9.2, -1.1"
TIMP_change,float64,0,75,-75.14,199.1,"14.6, 43.18, -24.4, 3.52, -29.78"
MMP_change,float64,0,75,-2176.83,1451.45,"-25.07, 75.02, -28.51, -37.69, 29.72"
P3NP_change,float64,0,72,-9.7,13.12,"-4.78, -4.34, 1.56, -5.0, 0.74"
Model thinking, summary: No missing values remain—the apparent gaps are just the text columns like arm and age, which is expected. Now I'll run the unpaired group comparison across the five change columns, since patients belong to a single arm, letting the harness handle test selection.
note The data hold 75 patients, one row for each patient (column Case, 75 distinct values). No column has missing values. The harness flag about missing min and max refers to the text columns arm and Age in the column summary. It is not a data problem. Each patient is in one arm only, so the two arms are independent groups.
plan The model updates its plan.
- done Inspect the table: columns, missing values, group sizes
- doing Compare the change in 25(OH)D between arms (vitamin_d minus placebo)
- todo Compare the change in TGF-beta1, TIMP-1, MMP-9 and P3NP between arms
- todo Correct the four marker p-values for multiple tests, if the scientist chose a correction
- todo Report the differences, 95% confidence intervals and p-values
Model
Next, I compare the change from baseline between the two arms for 25(OH)D and the four markers. The arms are independent groups of patients.
compare_two_groups (adapter biostats).paused The harness paused compare_two_groups until the scientist chose: Paired or unpaired test, Test family for two groups, Equal variances for an unpaired test, Sidedness. The decision cards follow.
decision card Paired test
Use a paired test if the same subject is measured in both groups (before and after, or both drugs in one patient). Use an unpaired test if the groups hold different subjects. The two choices can give different conclusions. The model wants to run compare_two_groups.
Options: yes no
Answer false
No person answered in this run. A script gave the answer that we wrote before the run, from the methods of the paper. Where the answer comes from: Statistical analysis section. The test compares the change in the vitamin D arm with the change in the placebo arm. The arms hold different patients. The pairing of baseline and week 6 is already in the change column.
decision card Test family for two groups
t is the t-test. It compares means and gives a confidence interval. wilcoxon is the rank test (signed-rank if paired, Mann-Whitney if unpaired). Use it if the data are far from normal or have outliers. The model wants to run compare_two_groups.
Options: t wilcoxon
Suggested: t (This is the adapter default.)
Answer t
No person answered in this run. A script gave the answer that we wrote before the run, from the methods of the paper. Where the answer comes from: Statistical analysis section, "the independent t-test". The quantile regression in Table 4 is a sensitivity analysis.
decision card Assume equal variances (unpaired t-test)
False gives the Welch test. It does not assume equal variances. True gives the Student test. Student's test is correct only if the group variances are equal. The model wants to run compare_two_groups.
Options: yes no
Suggested: false (This is the adapter default.)
Answer true
No person answered in this run. A script gave the answer that we wrote before the run, from the methods of the paper. Where the answer comes from: Not stated in the paper. The paper used Stata 16.1, whose ttest command assumes equal variances by default. The Student test reproduces the printed upper bound for 25(OH)D (26.4). The Welch test gives 26.5.
decision card Sidedness
Two-sided tests for a difference in either direction. One-sided tests for one direction only (the second group greater than the first, or less). Choose a one-sided test only if the other direction is not of interest, and decide before you see the data. The model wants to run compare_two_groups.
Options: two-sided greater less
Suggested: two-sided (This is the adapter default.)
Answer two-sided
No person answered in this run. A script gave the answer that we wrote before the run, from the methods of the paper. Where the answer comes from: Sample size calculation section, "a 2-sided significance level of 5%".
step n2 compare_two_groups adapter biostats 0.2.0, statsmodels, pingouin, lifelines 0.30.3
Student t-test (equal variances), two-sided: vitamin_d minus placebo = 23.09, statistic 13.72, p = 6.616e-22 (alpha 0.05).
Decisions applied: Significance level = 0.05; Paired or unpaired test = false; Test family for two groups = t; Equal variances for an unpaired test = true; Sidedness = two-sided.
Input file: {data}/sriphoosanaphan2021-vitd-hcv/vitd_hcv.csv SHA-256 0a0861006d85.
Outputs: two_group_test.csv (1c3c06d39752).
Arguments
| path | {data}/sriphoosanaphan2021-vitd-hcv/vitd_hcv.csv |
| outcome | VD_change |
| group | arm |
| id_column | Case |
| paired | false |
| test | t |
| equal_variance | true |
| alternative | two-sided |
| alpha | 0.05 |
Tool output
{
 "ok": true,
 "summary": "Student t-test (equal variances), two-sided: vitamin_d minus placebo = 23.09, statistic 13.72, p = 6.616e-22 (alpha 0.05).",
 "metrics": {
  "n_a": 38,
  "n_b": 37,
  "mean_diff": 23.086415362731152,
  "statistic": 13.723934695158828,
  "df": 73,
  "p_value": 6.615861523019445e-22,
  "ci_lo": 19.733793794132957,
  "ci_hi": 26.439036931329348,
  "effect_size": 3.1696887188680014,
  "mean_a": 1.4973684210526317,
  "mean_b": 24.583783783783783
 },
 "data": {
  "test": "Student t-test (equal variances)",
  "alternative": "two-sided",
  "direction": "vitamin_d minus placebo",
  "alpha": 0.05,
  "significant": true
 },
 "table": {
  "columns": [
   "test",
   "group_a",
   "group_b",
   "n_a",
   "n_b",
   "mean_diff_b_minus_a",
   "statistic",
   "df",
   "p",
   "ci_lo",
   "ci_hi",
   "cohen_d"
  ],
  "rows": [
   [
    "Student t-test (equal variances)",
    "placebo",
    "vitamin_d",
    38,
    37,
    23.086415362731152,
    13.723934695158828,
    73,
    6.615861523019445e-22,
    19.733793794132957,
    26.439036931329348,
    3.1696887188680014
   ]
  ],
  "n_rows": 1,
  "path": "{work}/compare_two_groups-1/two_group_test.csv"
 }
}
Model thinking, summary: I'm going with an unpaired two-sided Student's t-test, comparing 38 placebo participants against 37 vitamin D participants, and now moving to analyze the four markers.
Model
The harness set an unpaired Student t-test, two-sided, alpha 0.05. Placebo has 38 patients and vitamin D has 37. Next, I run the same test for the four fibrosis markers.
compare_two_groups (adapter biostats).step n3 compare_two_groups adapter biostats 0.2.0, statsmodels, pingouin, lifelines 0.30.3
Student t-test (equal variances), two-sided: vitamin_d minus placebo = -0.5543, statistic -0.4835, p = 0.6302 (alpha 0.05).
Decisions applied: Significance level = 0.05; Paired or unpaired test = false; Test family for two groups = t; Equal variances for an unpaired test = true; Sidedness = two-sided.
Input file: {data}/sriphoosanaphan2021-vitd-hcv/vitd_hcv.csv SHA-256 0a0861006d85.
Outputs: two_group_test.csv (2e41cd1d41ee).
Arguments
| path | {data}/sriphoosanaphan2021-vitd-hcv/vitd_hcv.csv |
| outcome | TGF_change |
| group | arm |
| id_column | Case |
| alpha | 0.05 |
| paired | false |
| test | t |
| equal_variance | true |
| alternative | two-sided |
Tool output
{
 "ok": true,
 "summary": "Student t-test (equal variances), two-sided: vitamin_d minus placebo = -0.5543, statistic -0.4835, p = 0.6302 (alpha 0.05).",
 "metrics": {
  "n_a": 38,
  "n_b": 37,
  "mean_diff": -0.5542816500711234,
  "statistic": -0.4834523278183658,
  "df": 73,
  "p_value": 0.6302215677645985,
  "ci_lo": -2.8392675151930034,
  "ci_hi": 1.7307042150507568,
  "effect_size": -0.11165845827996448,
  "mean_a": 1.0315789473684207,
  "mean_b": 0.4772972972972973
 },
 "data": {
  "test": "Student t-test (equal variances)",
  "alternative": "two-sided",
  "direction": "vitamin_d minus placebo",
  "alpha": 0.05,
  "significant": false
 },
 "table": {
  "columns": [
   "test",
   "group_a",
   "group_b",
   "n_a",
   "n_b",
   "mean_diff_b_minus_a",
   "statistic",
   "df",
   "p",
   "ci_lo",
   "ci_hi",
   "cohen_d"
  ],
  "rows": [
   [
    "Student t-test (equal variances)",
    "placebo",
    "vitamin_d",
    38,
    37,
    -0.5542816500711234,
    -0.4834523278183658,
    73,
    0.6302215677645985,
    -2.8392675151930034,
    1.7307042150507568,
    -0.11165845827996448
   ]
  ],
  "n_rows": 1,
  "path": "{work}/compare_two_groups-2/two_group_test.csv"
 }
}compare_two_groups (adapter biostats).step n4 compare_two_groups adapter biostats 0.2.0, statsmodels, pingouin, lifelines 0.30.3
Student t-test (equal variances), two-sided: vitamin_d minus placebo = -5.51, statistic -0.5267, p = 0.6 (alpha 0.05).
Decisions applied: Significance level = 0.05; Paired or unpaired test = false; Test family for two groups = t; Equal variances for an unpaired test = true; Sidedness = two-sided.
Input file: {data}/sriphoosanaphan2021-vitd-hcv/vitd_hcv.csv SHA-256 0a0861006d85.
Outputs: two_group_test.csv (b8630da84ac0).
Arguments
| path | {data}/sriphoosanaphan2021-vitd-hcv/vitd_hcv.csv |
| outcome | TIMP_change |
| group | arm |
| id_column | Case |
| alpha | 0.05 |
| paired | false |
| test | t |
| equal_variance | true |
| alternative | two-sided |
Tool output
{
 "ok": true,
 "summary": "Student t-test (equal variances), two-sided: vitamin_d minus placebo = -5.51, statistic -0.5267, p = 0.6 (alpha 0.05).",
 "metrics": {
  "n_a": 38,
  "n_b": 37,
  "mean_diff": -5.5101564722617375,
  "statistic": -0.5266719021952267,
  "df": 73,
  "p_value": 0.6000181795891157,
  "ci_lo": -26.361327697929894,
  "ci_hi": 15.34101475340642,
  "effect_size": -0.12164047877041008,
  "mean_a": 12.624210526315792,
  "mean_b": 7.114054054054055
 },
 "data": {
  "test": "Student t-test (equal variances)",
  "alternative": "two-sided",
  "direction": "vitamin_d minus placebo",
  "alpha": 0.05,
  "significant": false
 },
 "table": {
  "columns": [
   "test",
   "group_a",
   "group_b",
   "n_a",
   "n_b",
   "mean_diff_b_minus_a",
   "statistic",
   "df",
   "p",
   "ci_lo",
   "ci_hi",
   "cohen_d"
  ],
  "rows": [
   [
    "Student t-test (equal variances)",
    "placebo",
    "vitamin_d",
    38,
    37,
    -5.5101564722617375,
    -0.5266719021952267,
    73,
    0.6000181795891157,
    -26.361327697929894,
    15.34101475340642,
    -0.12164047877041008
   ]
  ],
  "n_rows": 1,
  "path": "{work}/compare_two_groups-3/two_group_test.csv"
 }
}compare_two_groups (adapter biostats).step n5 compare_two_groups adapter biostats 0.2.0, statsmodels, pingouin, lifelines 0.30.3
Student t-test (equal variances), two-sided: vitamin_d minus placebo = 122.9, statistic 1.277, p = 0.2058 (alpha 0.05).
Decisions applied: Significance level = 0.05; Paired or unpaired test = false; Test family for two groups = t; Equal variances for an unpaired test = true; Sidedness = two-sided.
Input file: {data}/sriphoosanaphan2021-vitd-hcv/vitd_hcv.csv SHA-256 0a0861006d85.
Outputs: two_group_test.csv (22aead36c356).
Arguments
| path | {data}/sriphoosanaphan2021-vitd-hcv/vitd_hcv.csv |
| outcome | MMP_change |
| group | arm |
| id_column | Case |
| alpha | 0.05 |
| paired | false |
| test | t |
| equal_variance | true |
| alternative | two-sided |
Tool output
{
 "ok": true,
 "summary": "Student t-test (equal variances), two-sided: vitamin_d minus placebo = 122.9, statistic 1.277, p = 0.2058 (alpha 0.05).",
 "metrics": {
  "n_a": 38,
  "n_b": 37,
  "mean_diff": 122.92064722617353,
  "statistic": 1.2767027662855421,
  "df": 73,
  "p_value": 0.20575360709572219,
  "ci_lo": -68.96465537016569,
  "ci_hi": 314.80594982251273,
  "effect_size": 0.2948680859775849,
  "mean_a": -14.856052631578953,
  "mean_b": 108.06459459459458
 },
 "data": {
  "test": "Student t-test (equal variances)",
  "alternative": "two-sided",
  "direction": "vitamin_d minus placebo",
  "alpha": 0.05,
  "significant": false
 },
 "table": {
  "columns": [
   "test",
   "group_a",
   "group_b",
   "n_a",
   "n_b",
   "mean_diff_b_minus_a",
   "statistic",
   "df",
   "p",
   "ci_lo",
   "ci_hi",
   "cohen_d"
  ],
  "rows": [
   [
    "Student t-test (equal variances)",
    "placebo",
    "vitamin_d",
    38,
    37,
    122.92064722617353,
    1.2767027662855421,
    73,
    0.20575360709572219,
    -68.96465537016569,
    314.80594982251273,
    0.2948680859775849
   ]
  ],
  "n_rows": 1,
  "path": "{work}/compare_two_groups-4/two_group_test.csv"
 }
}compare_two_groups (adapter biostats).step n6 compare_two_groups adapter biostats 0.2.0, statsmodels, pingouin, lifelines 0.30.3
Student t-test (equal variances), two-sided: vitamin_d minus placebo = -0.1104, statistic -0.09728, p = 0.9228 (alpha 0.05).
Decisions applied: Significance level = 0.05; Paired or unpaired test = false; Test family for two groups = t; Equal variances for an unpaired test = true; Sidedness = two-sided.
Input file: {data}/sriphoosanaphan2021-vitd-hcv/vitd_hcv.csv SHA-256 0a0861006d85.
Outputs: two_group_test.csv (9948aa5ebec9).
Arguments
| path | {data}/sriphoosanaphan2021-vitd-hcv/vitd_hcv.csv |
| outcome | P3NP_change |
| group | arm |
| id_column | Case |
| alpha | 0.05 |
| paired | false |
| test | t |
| equal_variance | true |
| alternative | two-sided |
Tool output
{
 "ok": true,
 "summary": "Student t-test (equal variances), two-sided: vitamin_d minus placebo = -0.1104, statistic -0.09728, p = 0.9228 (alpha 0.05).",
 "metrics": {
  "n_a": 38,
  "n_b": 37,
  "mean_diff": -0.11039118065433862,
  "statistic": -0.0972833983817803,
  "df": 73,
  "p_value": 0.9227679456807509,
  "ci_lo": -2.371920993832504,
  "ci_hi": 2.151138632523827,
  "effect_size": -0.0224686357982048,
  "mean_a": -0.8144736842105262,
  "mean_b": -0.9248648648648649
 },
 "data": {
  "test": "Student t-test (equal variances)",
  "alternative": "two-sided",
  "direction": "vitamin_d minus placebo",
  "alpha": 0.05,
  "significant": false
 },
 "table": {
  "columns": [
   "test",
   "group_a",
   "group_b",
   "n_a",
   "n_b",
   "mean_diff_b_minus_a",
   "statistic",
   "df",
   "p",
   "ci_lo",
   "ci_hi",
   "cohen_d"
  ],
  "rows": [
   [
    "Student t-test (equal variances)",
    "placebo",
    "vitamin_d",
    38,
    37,
    -0.11039118065433862,
    -0.0972833983817803,
    73,
    0.9227679456807509,
    -2.371920993832504,
    2.151138632523827,
    -0.0224686357982048
   ]
  ],
  "n_rows": 1,
  "path": "{work}/compare_two_groups-5/two_group_test.csv"
 }
}
Model
There are four marker tests for one question. Next, I adjust the four marker p-values for multiple tests.
adjust_pvalues (adapter biostats).paused The harness paused adjust_pvalues until the scientist chose: Correction for a list of p-values. The decision cards follow.
decision card Correction for a list of p-values
Use this when you ran many tests. Bonferroni, Holm and Sidak control the chance of any false positive. fdr_bh and fdr_by control the share of false positives among the positives. The model wants to run adjust_pvalues.
Options: bonferroni holm sidak fdr_bh fdr_by
Suggested: holm (This is the adapter default.)
Answer holm
No person answered in this run. A script gave the answer that we wrote before the run, from the methods of the paper.
step n7 adjust_pvalues adapter biostats 0.2.0, statsmodels, pingouin, lifelines 0.30.3
holm correction of 4 p-values at alpha 0.05: 0 rejected.
Decisions applied: Significance level = 0.05; Correction for a list of p-values = holm.
Outputs: adjusted_p.csv (12e04b44cd0f).
Arguments
| pvalues | [0.6302215677645985,0.6000181795891157,0.20575360709572219,0.9227679456807509] |
| method | holm |
| alpha | 0.05 |
Tool output
{
 "ok": true,
 "summary": "holm correction of 4 p-values at alpha 0.05: 0 rejected.",
 "metrics": {
  "n_tests": 4,
  "n_rejected": 0
 },
 "table": {
  "columns": [
   "p_raw",
   "p_adjusted",
   "reject"
  ],
  "rows": [
   [
    0.6302215677645985,
    1,
    false
   ],
   [
    0.6000181795891157,
    1,
    false
   ],
   [
    0.20575360709572219,
    0.8230144283828887,
    false
   ],
   [
    0.9227679456807509,
    1,
    false
   ]
  ],
  "n_rows": 4,
  "path": "{work}/adjust_pvalues-1/adjusted_p.csv"
 }
}read_file.Result of read_file: Read 156 of 156 bytes from {work}/adjust_pvalues-1/adjusted_p.csv.
p_raw,p_adjusted,reject
0.6302215677645985,1.0,False
0.6000181795891157,1.0,False
0.20575360709572219,0.8230144283828887,False
0.9227679456807509,1.0,False
Model
Next, I save one summary table with the five comparisons.
The model runs run_script.
from ga_api import save_table
rows = [
 dict(outcome="25(OH)D change", unit="ng/mL", n_placebo=38, n_vitd=37, mean_change_placebo=1.4973684210526317, mean_change_vitd=24.583783783783783, diff_vitd_minus_placebo=23.086415362731152, ci95_lo=19.733793794132957, ci95_hi=26.439036931329348, t=13.723934695158828, df=73, p=6.615861523019445e-22, p_holm_4_markers="", cohen_d=3.1696887188680014),
 dict(outcome="TGF-beta1 change", unit="ng/mL", n_placebo=38, n_vitd=37, mean_change_placebo=1.0315789473684207, mean_change_vitd=0.4772972972972973, diff_vitd_minus_placebo=-0.5542816500711234, ci95_lo=-2.8392675151930034, ci95_hi=1.7307042150507568, t=-0.4834523278183658, df=73, p=0.6302215677645985, p_holm_4_markers=1.0, cohen_d=-0.11165845827996448),
 dict(outcome="TIMP-1 change", unit="ng/mL", n_placebo=38, n_vitd=37, mean_change_placebo=12.624210526315792, mean_change_vitd=7.114054054054055, diff_vitd_minus_placebo=-5.5101564722617375, ci95_lo=-26.361327697929894, ci95_hi=15.34101475340642, t=-0.5266719021952267, df=73, p=0.6000181795891157, p_holm_4_markers=1.0, cohen_d=-0.12164047877041008),
 dict(outcome="MMP-9 change", unit="ng/mL", n_placebo=38, n_vitd=37, mean_change_placebo=-14.856052631578953, mean_change_vitd=108.06459459459458, diff_vitd_minus_placebo=122.92064722617353, ci95_lo=-68.96465537016569, ci95_hi=314.80594982251273, t=1.2767027662855421, df=73, p=0.20575360709572219, p_holm_4_markers=0.8230144283828887, cohen_d=0.2948680859775849),
 dict(outcome="P3NP change", unit="ng/mL", n_placebo=38, n_vitd=37, mean_change_placebo=-0.8144736842105262, mean_change_vitd=-0.9248648648648649, diff_vitd_minus_placebo=-0.11039118065433862, ci95_lo=-2.371920993832504, ci95_hi=2.151138632523827, t=-0.0972833983817803, df=73, p=0.9227679456807509, p_holm_4_markers=1.0, cohen_d=-0.0224686357982048),
]
save_table("change_comparisons", rows)
print("saved")run_script. In this validation, the harness lets the model use every tool and does not ask the scientist.step n8 run_script
The script ran in {work} and wrote 1 new file(s) to {work}.
Outputs: change_comparisons.csv (d91c4b55a92d).
Arguments
| purpose | Save one table with the five comparisons. |
| does | Collects the five two-group results and the Holm-adjusted p-values into one table (change_comparisons.csv). |
| code | from ga_api import save_table
rows = [
dict(outcome="25(OH)D change", unit="ng/mL", n_placebo=38, n_vitd=37, mean_change_placebo=1.4973684210526317, mean_change_vitd=24.583783783783783, diff_vitd_minus_placebo=23.086415362731152, ci95_lo=19.733793794132957, ci95_hi=26.439036931329348, t=13.723934695158828, df=73, p=6.615861523019445e-22, p_holm_4_markers="", cohen_d=3.1696887188680014),
dict(out ... |
Tool output
saved
plan The model updates its plan.
- done Inspect the table: columns, missing values, group sizes
- done Compare the change in 25(OH)D between arms (vitamin_d minus placebo)
- done Compare the change in TGF-beta1, TIMP-1, MMP-9 and P3NP between arms
- done Correct the four marker p-values for multiple tests (Holm)
- done Report the differences, 95% confidence intervals and p-values
Model thinking, summary: Time to write the final answer with sensibly rounded numbers.
Model Answer draft 1. The claim check and the review read it.
Vitamin D raised 25(OH)D by about 23 ng/mL more than placebo. It did not change any of the four fibrosis markers compared with placebo at alpha 0.05.
Design and test
- One replicate is one patient. The file has 75 patients and 75 rows, with no missing values.
- Placebo has n = 38 and vitamin D has n = 37. Each patient is in one arm only, so the groups are independent.
- The settings come from the decision record: an unpaired Student t-test (equal variances), two-sided, alpha 0.05.
- The outcome is the week-6 value minus the baseline value. Each difference is vitamin D minus placebo, in ng/mL.
- The effect size is Cohen's d, which the same test step reports.
Results (from the compare_two_groups steps, df = 73 for each)
| Outcome | Mean change, placebo | Mean change, vitamin D | Difference (vitamin D − placebo) | 95% CI | p | Holm-adjusted p | Cohen's d |
|---|---|---|---|---|---|---|---|
| 25(OH)D | 1.50 | 24.58 | 23.09 | 19.73 to 26.44 | 6.6 × 10⁻²² | not in the family | 3.17 |
| TGF-beta1 | 1.03 | 0.48 | −0.55 | −2.84 to 1.73 | 0.630 | 1.000 | −0.11 |
| TIMP-1 | 12.62 | 7.11 | −5.51 | −26.36 to 15.34 | 0.600 | 1.000 | −0.12 |
| MMP-9 | −14.86 | 108.06 | 122.92 | −68.96 to 314.81 | 0.206 | 0.823 | 0.29 |
| P3NP | −0.81 | −0.92 | −0.11 | −2.37 to 2.15 | 0.923 | 1.000 | −0.02 |
The t statistics are 13.72 for 25(OH)D, −0.48 for TGF-beta1, −0.53 for TIMP-1, 1.28 for MMP-9 and −0.10 for P3NP.
What the results show
- 25(OH)D: Vitamin D raised 25(OH)D significantly more than placebo (alpha 0.05). The effect is large.
- Fibrosis markers: None of the four markers differs between the arms, before or after the Holm correction (alpha 0.05). The Holm correction covers 4 tests, and none passes it.
- Interpretation: The data show no effect of 6 weeks of vitamin D2 on these markers. They do not prove that there is no effect, because the confidence intervals are wide. For MMP-9, the interval reaches about +315 ng/mL in one direction and −69 ng/mL in the other.
What is uncertain
- MMP-9 values: The MMP-9 change has some very large values, from −2176.83 to 1451.45 ng/mL. A few patients can move a mean-based t-test a lot. I did not run a rank test as a check. A Mann-Whitney test on the MMP-9 change would test whether this result holds without the normal assumption. Its p-value would not be adjusted with the four tests above.
- Equal variances: The Student t-test assumes equal variances in the two arms. I did not check this assumption.
- No adjustment for baseline: The analysis compares change scores only. It does not adjust for the baseline values.
What waits for you
- You can ask me to run the Mann-Whitney check on the MMP-9 change.
- You can ask for a baseline-adjusted model (ANCOVA, analysis of covariance) of the week-6 values.
Files
change_comparisons.csvhas all five comparisons and the Holm-adjusted p-values.adjust_pvalues-1/adjusted_p.csvhas the Holm correction alone.
review The review sent the answer back to the model before the scientist saw it.
- 1 number in the answer match no logged tool result: -2176.83. Run the tool that measures each number, or remove the number, or say how you derived it from logged results.
Fix these problems. Then give the answer again.
Model thinking, summary: That -2176.83 value traces back to the inspect_table output I read via read_file, so the review may not be recognizing that source. Since citing it that way got flagged, it's safer to just remove that specific reference rather than try to justify it further.
Model The model writes its answer. The claim check reads it. See the final answer.
The final answer
The model wrote this answer. The harness shows it to the scientist after the review.
Vitamin D raised 25(OH)D by about 23 ng/mL more than placebo. It did not change any of the four fibrosis markers compared with placebo at alpha 0.05.
Design and test
- One replicate is one patient. The file has 75 patients and 75 rows, with no missing values.
- Placebo has n = 38 and vitamin D has n = 37. Each patient is in one arm only, so the groups are independent.
- The settings come from the decision record: an unpaired Student t-test (equal variances), two-sided, alpha 0.05.
- The outcome is the week-6 value minus the baseline value. Each difference is vitamin D minus placebo, in ng/mL.
- The effect size is Cohen's d, which the same test step reports.
Results (from the compare_two_groups steps, df = 73 for each)
| Outcome | Mean change, placebo | Mean change, vitamin D | Difference (vitamin D − placebo) | 95% CI | p | Holm-adjusted p | Cohen's d |
|---|---|---|---|---|---|---|---|
| 25(OH)D | 1.50 | 24.58 | 23.09 | 19.73 to 26.44 | 6.6 × 10⁻²² | not in the family | 3.17 |
| TGF-beta1 | 1.03 | 0.48 | −0.55 | −2.84 to 1.73 | 0.630 | 1.000 | −0.11 |
| TIMP-1 | 12.62 | 7.11 | −5.51 | −26.36 to 15.34 | 0.600 | 1.000 | −0.12 |
| MMP-9 | −14.86 | 108.06 | 122.92 | −68.96 to 314.81 | 0.206 | 0.823 | 0.29 |
| P3NP | −0.81 | −0.92 | −0.11 | −2.37 to 2.15 | 0.923 | 1.000 | −0.02 |
The t statistics are 13.72 for 25(OH)D, −0.48 for TGF-beta1, −0.53 for TIMP-1, 1.28 for MMP-9 and −0.10 for P3NP.
What the results show
- 25(OH)D: Vitamin D raised 25(OH)D significantly more than placebo (alpha 0.05). The effect is large.
- Fibrosis markers: None of the four markers differs between the arms, before or after the Holm correction (alpha 0.05). The Holm correction covers 4 tests, and none passes it.
- Interpretation: The data show no effect of 6 weeks of vitamin D2 on these markers. They do not prove that there is no effect, because the confidence intervals are wide. For MMP-9, the interval reaches about +315 ng/mL in one direction and −69 ng/mL in the other.
What is uncertain
- MMP-9 values: The column summary from inspect_table shows a very wide range for the MMP-9 change, with large negative and large positive values. A few patients can move a mean-based t-test a lot. I did not run a rank test as a check. A Mann-Whitney test on the MMP-9 change would test whether this result holds without the normal assumption. Its p-value would not be adjusted with the four tests above.
- Equal variances: The Student t-test assumes equal variances in the two arms. I did not check this assumption.
- No adjustment for baseline: The analysis compares change scores only. It does not adjust for the baseline values.
What waits for you
- You can ask me to run the Mann-Whitney check on the MMP-9 change.
- You can ask for a baseline-adjusted model (ANCOVA, analysis of covariance) of the week-6 values.
Files
change_comparisons.csvhas all five comparisons and the Holm-adjusted p-values.adjust_pvalues-1/adjusted_p.csvhas the Holm correction alone.
Settings and step results that the answer does not mention. The harness adds them.
Step results that the answer does not mention, from the record:
- n8 run_script: The script ran in {work} and wrote 1 new file(s) to {work}.

Settings used, from the decision record: Significance level (alpha): 0.05 · Paired test: false · Test family for two groups: t · Assume equal variances (unpaired t-test): true · Sidedness: two-sided · Correction for a list of p-values: holm.
Values that are not scored
- A trap value is the result of a wrong method, for example an unpaired test on paired data. A trap value in a main step means that the run used the wrong method. A trap value in a comparison run is correct, because the record keeps the scientist's choice.
- An optional value is a second result of the same method. The run can compute it or not.
- A reference value comes from a different program version or a check run by us. We show it for comparison.
| Item | Kind | Known value | Closest logged value | Tolerance | Outcome | Source of the known value |
|---|---|---|---|---|---|---|
mmp_week6_trapMMP-9 at week 6 only, vitamin D minus placebo (trap result) | trap | 129.06 | 122.9206n5 compare_two_groups | ± 0.05 | not in the record | We calculated it with SciPy ttest_ind with equal_var=True on MMP6 |
Checks
Review findings
The review recorded 6 findings. A rule finding comes from a fixed check in the harness. A referee finding comes from a second model that reads the record. The harness shows the findings to the scientist with the final answer. The record does not mark a finding as fixed. Thus a finding from an early review round can apply to a draft that the model corrected later.
| Severity | From | Finding | Shown with the final answer |
|---|---|---|---|
| info | ruletext_style | The answer breaks the text rules (ASD-STE100) in 1 place. Sentence 27 uses the passive voice: "be adjusted". Use the active voice. | yes |
| warning | referee model | The answer gives ng/mL as the unit of every difference, and it gives the MMP-9 interval as +315 and −69 ng/mL. The log shows the unit only for 25(OH)D. No logged step gives the units of TGF-beta1, TIMP-1, MMP-9 or P3NP. The answer must not assign units that the log does not support. | yes |
| warning | referee model | The answer says that the inspect_table summary shows a very wide range of MMP-9 change, with large negative and positive values. The logged summary does not show an MMP-9 change column, and no step gives its range. This statement has no logged source. | yes |
| warning | referee model | The opening sentence says that vitamin D did not change any of the four fibrosis markers. Non-significant tests with wide intervals do not show that there is no change. The MMP-9 interval spans −69 to +315. The answer qualifies this later, but the first sentence must say 'no significant difference was detected'. | yes |
| info | referee model | The scientist chose the Student t-test with equal variances. The analysis did not check this assumption. The answer states this limit, and it states the limit of no baseline adjustment. The MMP-9 result may depend on outliers that the analysis did not examine. | yes |
| info | referee model | The answer reports the test name, sidedness, alpha, n per arm, the direction (vitamin D minus placebo), the 95% CI, Cohen's d and Holm-adjusted p-values for the four marker tests. These match the logged results. The 25(OH)D test is not part of the Holm family, and the answer says so. | yes |
Numbers in the answer
The last claim check read 68 numbers in the answer. 68 numbers match a logged result. 0 numbers have no source in the record.
Deviations
The model did not try to change a choice of the scientist.
Failed tool calls
No tool call failed.
Data integrity
Each data file has the same SHA-256 hash now as at the time of the step that read it. Where the download script (fetch.sh) gives a hash, the file also has that hash. The run did not change the data.
| File | SHA-256 | Fetched data | Steps with this hash |
|---|---|---|---|
{data}/sriphoosanaphan2021-vitd-hcv/vitd_hcv.csv11.8 KB | 0a0861006d85 | same as the hash in the download script (fetch.sh) | n1, n2, n3, n4, n5, n6 |
A SHA-256 hash is a fingerprint of the file contents. If one byte of the file changes, the hash changes. The table shows the first 12 characters.
How to repeat it
Get the data. The script downloads the files and checks their SHA-256 hashes where it lists them.
CUVETTE_DATA={data} bash bench/papers/sriphoosanaphan2021-vitd-hcv/fetch.shRun the same case with Cuvette. The script gives the same answers from bench/papers/sriphoosanaphan2021-vitd-hcv/bench.yaml.
cuvette bench papers --papers sriphoosanaphan2021-vitd-hcv --models claude:claude-opus-5-5
Repeat each step by hand in the program. For each step, the harness records a manual route: the menu path or the code that gives the same result. This list does not include comparison runs.
inspect_table(step n1)Code
print(pd.read_csv(path).describe(include='all'))path
{data}/sriphoosanaphan2021-vitd-hcv/vitd_hcv.csv- Note: The tool also counts distinct values and missing values for each column.
The manual route that the harness recorded
ga_biostats.inspect_table(path="{data}/sriphoosanaphan2021-vitd-hcv/vitd_hcv.csv")The manual route uses the same method. The note in the route gives the known difference.
compare_two_groups(step n2)Code
scipy.stats.ttest_ind(x, y, equal_var=False) # Welch. equal_var=True is Student. scipy.stats.mannwhitneyu(x, y) # rank test- equal_var =
true - alternative =
two-sided
The manual route that the harness recorded
ga_biostats.compare_two_groups(path="{data}/sriphoosanaphan2021-vitd-hcv/vitd_hcv.csv", outcome="VD_change", group="arm", test="t", paired=False, id_column="Case", alternative="two-sided", alpha=0.05, equal_variance=True)The manual route gives the same numbers. An automatic test in Cuvette checks this.
- equal_var =
compare_two_groups(step n3)Code
scipy.stats.ttest_ind(x, y, equal_var=False) # Welch. equal_var=True is Student. scipy.stats.mannwhitneyu(x, y) # rank test- equal_var =
true - alternative =
two-sided
The manual route that the harness recorded
ga_biostats.compare_two_groups(path="{data}/sriphoosanaphan2021-vitd-hcv/vitd_hcv.csv", outcome="TGF_change", group="arm", test="t", paired=False, id_column="Case", alternative="two-sided", alpha=0.05, equal_variance=True)The manual route gives the same numbers. An automatic test in Cuvette checks this.
- equal_var =
compare_two_groups(step n4)Code
scipy.stats.ttest_ind(x, y, equal_var=False) # Welch. equal_var=True is Student. scipy.stats.mannwhitneyu(x, y) # rank test- equal_var =
true - alternative =
two-sided
The manual route that the harness recorded
ga_biostats.compare_two_groups(path="{data}/sriphoosanaphan2021-vitd-hcv/vitd_hcv.csv", outcome="TIMP_change", group="arm", test="t", paired=False, id_column="Case", alternative="two-sided", alpha=0.05, equal_variance=True)The manual route gives the same numbers. An automatic test in Cuvette checks this.
- equal_var =
compare_two_groups(step n5)Code
scipy.stats.ttest_ind(x, y, equal_var=False) # Welch. equal_var=True is Student. scipy.stats.mannwhitneyu(x, y) # rank test- equal_var =
true - alternative =
two-sided
The manual route that the harness recorded
ga_biostats.compare_two_groups(path="{data}/sriphoosanaphan2021-vitd-hcv/vitd_hcv.csv", outcome="MMP_change", group="arm", test="t", paired=False, id_column="Case", alternative="two-sided", alpha=0.05, equal_variance=True)The manual route gives the same numbers. An automatic test in Cuvette checks this.
- equal_var =
compare_two_groups(step n6)Code
scipy.stats.ttest_ind(x, y, equal_var=False) # Welch. equal_var=True is Student. scipy.stats.mannwhitneyu(x, y) # rank test- equal_var =
true - alternative =
two-sided
The manual route that the harness recorded
ga_biostats.compare_two_groups(path="{data}/sriphoosanaphan2021-vitd-hcv/vitd_hcv.csv", outcome="P3NP_change", group="arm", test="t", paired=False, id_column="Case", alternative="two-sided", alpha=0.05, equal_variance=True)The manual route gives the same numbers. An automatic test in Cuvette checks this.
- equal_var =
adjust_pvalues(step n7)Code
statsmodels.stats.multitest.multipletests(pvals, alpha=0.05, method='holm')- method =
holm - Warning: If you keep the default hs, you get a different result.
The manual route that the harness recorded
ga_biostats.adjust_pvalues(pvalues=[0.6302215677645985, 0.6000181795891157, 0.20575360709572219, 0.9227679456807509], method="holm", alpha=0.05)The manual route gives the same numbers. An automatic test in Cuvette checks this.
- method =
run_script(step n8)Run the Python code in {work}/script-1/script.py
- Code only: this step has no route in the program menus. Run it with the script or flow export.
The program has no menu route for this step. To repeat it, run the code.
Figure
Run facts
| Model | claude-opus-5-5 through the Anthropic service |
| Date | 2026-10-09 12:59:26 UTC |
| End of run | the model gave a final answer |
| Time | 101 s |
| Requests to the model | 12 |
| Tokensunits of text that the model read and wrote | 28 input, 7229 output, 254024 cache read, 30551 cache write |
| Cost estimate | $0.35 at list price, from the token counts |
| Tool calls | 14 (0 failed) |
| Adapters | biostats 0.2.0, program 0.30.3 |
| Session | 20261009-075926-77a5 |
Code hash of each step (8)
| Step | Tool | Program version | Code hash |
|---|---|---|---|
| n1 | inspect_table | 0.30.3 | 603f546a1fe4 |
| n2 | compare_two_groups | 0.30.3 | 1ad4cb82ccf4 |
| n3 | compare_two_groups | 0.30.3 | 1ad4cb82ccf4 |
| n4 | compare_two_groups | 0.30.3 | 1ad4cb82ccf4 |
| n5 | compare_two_groups | 0.30.3 | 1ad4cb82ccf4 |
| n6 | compare_two_groups | 0.30.3 | 1ad4cb82ccf4 |
| n7 | adjust_pvalues | 0.30.3 | 6cce9d622e70 |
| n8 | run_script | - | 995d74a3af3a |
The code hash is a fingerprint of the adapter name, the adapter version, the tool and its definition in the adapter. If one of these changes, the hash changes.
Sonnet · claude-sonnet-5-5 · run 3 of 3 shown 21 of 21 values match, 19 of 19 correct in the final answer
The session
This is the session as the scientist sees it, in order. Decision cards show the answer that the script gave and where that answer comes from. Each step shows the program, its version, the input file hash and the outputs. Click a line to see more.
setup The decision record starts with these values. A script set them before the first message, from the answers that we wrote before the run.
- Unit of replication: subjects, patients or animals (one value per subject)Where the answer comes from: Patient characteristics section. Each of the 75 randomized patients gives one change for each marker.
- Significance level: 0.05Where the answer comes from: Sample size calculation section. The trial used a two-sided significance level of 5%.
harness note A note from the harness to the model. The scientist did not write it.
- Setup values:
Design:
- What is the unit of replication? (replicate): subjects, patients or animals (one value per subject)
Inference:
- Significance level (alpha) (alpha): 0.05
Ask the scientist: Paired test (paired), Test family for two groups (two_group_test), Assume equal variances (unpaired t-test) (equal_variance), Sidedness (alternative), ANOVA variance assumption (anova_variance), Pairwise comparisons after ANOVA (posthoc), Correction for a list of p-values (p_adjust_method), Model formula (model_formula), Standard errors for the linear model (standard_errors), Random effects of the mixed model (random_effects), Fit by REML (reml), Covariates of the Cox model (cox_covariates), Ties method of the Cox model (ties), Strata of the Cox model (cox_strata), Type of sums of squares (ss_type), Comparisons of the cell means after a factorial ANOVA (factorial_posthoc), Sphericity correction for repeated measures (sphericity_correction), Correction after a rank test over many groups (rank_p_adjust), Exact or approximate p value for a rank test (exact_p), Covariates of the logistic model (logistic_covariates), Outcome value that counts as the event (logistic_event), Reference level of each categorical covariate (reference_levels), Yates continuity correction for a 2x2 chi-square test (chi_square_correction), Sidedness of the Fisher exact test (fisher_alternative), Method of the McNemar test (mcnemar_method).
The harness fills these values into your tool calls automatically. If you give a different value, the harness logs a deviation and shows it to the scientist.
- Mode is now watch: you run the steps.
inspect_table (adapter biostats).step n1 inspect_table adapter biostats 0.2.0, statsmodels, pingouin, lifelines 0.30.3
75 rows x 31 columns.
Input file: {data}/sriphoosanaphan2021-vitd-hcv/vitd_hcv.csv SHA-256 0a0861006d85.
Outputs: columns.csv (e9df16101f7e).
Arguments
| path | {data}/sriphoosanaphan2021-vitd-hcv/vitd_hcv.csv |
Tool output
{
 "ok": true,
 "summary": "75 rows x 31 columns.",
 "metrics": {
  "n_rows": 75,
  "n_columns": 31
 },
 "table": {
  "columns": [
   "column",
   "dtype",
   "n_missing",
   "n_unique",
   "min",
   "max",
   "first_values"
  ],
  "rows": [
   [
    "Case",
    "int64",
    0,
    75,
    1,
    75,
    "1, 2, 3, 4, 5"
   ],
   [
    "arm",
    "object",
    0,
    2,
    null,
    null,
    "vitamin_d, placebo"
   ],
   [
    "Sex",
    "int64",
    0,
    2,
    1,
    2,
    "2, 1"
   ],
   [
    "Age",
    "object",
    0,
    5,
    null,
    null,
    "61-70, 51-60, 71-80, 31-40, 41-50"
   ],
   [
    "BW",
    "float64",
    0,
    58,
    42,
    103,
    "53.5, 73.0, 62.3, 79.0, 75.7"
   ],
   [
    "Height",
    "int64",
    0,
    26,
    144,
    178,
    "160, 161, 153, 169, 178"
   ],
   [
    "BMI",
    "float64",
    0,
    74,
    16.38,
    36.22,
    "20.9, 28.16, 26.61, 27.66, 23.89"
   ],
   [
    "FIB4",
    "float64",
    0,
    72,
    0.64,
    12.56,
    "2.96, 0.98, 7.29, 0.94, 10.42"
   ],
   [
    "APRI",
    "float64",
    0,
    50,
    0.14,
    2.73,
    "0.45, 0.24, 1.35, 0.17, 2.54"
   ],
   [
    "VD0",
    "float64",
    0,
    62,
    8.3,
    24.2,
    "21.7, 11.3, 13.8, 18.3, 12.1"
   ],
   [
    "AST0",
    "int64",
    0,
    34,
    13,
    103,
    "26, 24, 42, 13, 64"
   ],
   [
    "ALT0",
    "float64",
    0,
    35,
    5,
    49,
    "18.0, 26.0, 14.0, 32.0, 7.0"
   ],
   [
    "Plt0",
    "int64",
    0,
    64,
    43,
    357,
    "143, 250, 78, 195, 63"
   ],
   [
    "VD6",
    "float64",
    0,
    71,
    7.8,
    64.3,
    "38.5, 40.1, 15.1, 16.6, 53.2"
   ],
   [
    "AST6",
    "int64",
    0,
    35,
    10,
    100,
    "42, 24, 43, 15, 40"
   ]
  ],
  "n_rows": 31,
  "path": "{work}/inspect_table-1/columns.csv"
 }
}read_file.Result of read_file: Read 1894 of 1894 bytes from {work}/inspect_table-1/columns.csv.
column,dtype,n_missing,n_unique,min,max,first_values
Case,int64,0,75,1.0,75.0,"1, 2, 3, 4, 5"
arm,object,0,2,,,"vitamin_d, placebo"
Sex,int64,0,2,1.0,2.0,"2, 1"
Age,object,0,5,,,"61-70, 51-60, 71-80, 31-40, 41-50"
BW,float64,0,58,42.0,103.0,"53.5, 73.0, 62.3, 79.0, 75.7"
Height,int64,0,26,144.0,178.0,"160, 161, 153, 169, 178"
BMI,float64,0,74,16.38,36.22,"20.9, 28.16, 26.61, 27.66, 23.89"
FIB4,float64,0,72,0.64,12.56,"2.96, 0.98, 7.29, 0.94, 10.42"
APRI,float64,0,50,0.14,2.73,"0.45, 0.24, 1.35, 0.17, 2.54"
VD0,float64,0,62,8.3,24.2,"21.7, 11.3, 13.8, 18.3, 12.1"
AST0,int64,0,34,13.0,103.0,"26, 24, 42, 13, 64"
ALT0,float64,0,35,5.0,49.0,"18.0, 26.0, 14.0, 32.0, 7.0"
Plt0,int64,0,64,43.0,357.0,"143, 250, 78, 195, 63"
VD6,float64,0,71,7.8,64.3,"38.5, 40.1, 15.1, 16.6, 53.2"
AST6,int64,0,35,10.0,100.0,"42, 24, 43, 15, 40"
ALT6,int64,0,35,5.0,66.0,"37, 25, 28, 19, 32"
TGF0,float64,0,69,3.74,52.28,"12.62, 23.12, 7.16, 17.85, 7.63"
TGF6,float64,0,73,3.2,32.99,"16.16, 25.13, 7.77, 27.05, 6.53"
TIMP0,float64,0,74,138.22,390.82,"232.03, 212.85, 234.67, 229.39, 327.94"
TIMP6,float64,0,74,152.4,482.42,"246.63, 256.03, 210.27, 232.91, 298.16"
MMP0,float64,0,73,60.09,2827.85,"223.86, 802.05, 111.7, 1183.67, 334.03"
MMP6,float64,0,75,63.93,2183.48,"198.79, 877.07, 83.19, 1145.98, 363.75"
P3NP0,float64,0,69,17.32,46.14,"37.75, 29.83, 27.78, 26.87, 25.07"
P3NP6,float64,0,68,17.99,50.33,"32.97, 25.49, 29.34, 21.87, 25.81"
VD_change,float64,0,63,-2.7,52.7,"16.8, 28.8, 1.3, -1.7, 3.0"
AST_change,int64,0,25,-24.0,44.0,"16, 0, 1, 2, -24"
ALT_change,float64,0,28,-20.0,49.0,"19.0, -1.0, 2.0, 5.0, 0.0"
TGF_change,float64,0,73,-19.29,11.15,"3.54, 2.01, 0.61, 9.2, -1.1"
TIMP_change,float64,0,75,-75.14,199.1,"14.6, 43.18, -24.4, 3.52, -29.78"
MMP_change,float64,0,75,-2176.83,1451.45,"-25.07, 75.02, -28.51, -37.69, 29.72"
P3NP_change,float64,0,72,-9.7,13.12,"-4.78, -4.34, 1.56, -5.0, 0.74"
Model thinking, summary: Data looks complete with nothing missing. I'll run compare_two_groups for each of the five outcomes, treating them as unpaired independent arms with a t-test family, letting the harness populate the actual values.
Model
I compare the change from baseline between the two arms for each of the five outcomes. The arms are independent, so the test is unpaired.
compare_two_groups (adapter biostats).paused The harness paused compare_two_groups until the scientist chose: Paired or unpaired test, Test family for two groups, Equal variances for an unpaired test, Sidedness. The decision cards follow.
decision card Paired test
Use a paired test if the same subject is measured in both groups (before and after, or both drugs in one patient). Use an unpaired test if the groups hold different subjects. The two choices can give different conclusions. The model wants to run compare_two_groups.
Options: yes no
Answer false
No person answered in this run. A script gave the answer that we wrote before the run, from the methods of the paper. Where the answer comes from: Statistical analysis section. The test compares the change in the vitamin D arm with the change in the placebo arm. The arms hold different patients. The pairing of baseline and week 6 is already in the change column.
decision card Test family for two groups
t is the t-test. It compares means and gives a confidence interval. wilcoxon is the rank test (signed-rank if paired, Mann-Whitney if unpaired). Use it if the data are far from normal or have outliers. The model wants to run compare_two_groups.
Options: t wilcoxon
Suggested: t (This is the adapter default.)
Answer t
No person answered in this run. A script gave the answer that we wrote before the run, from the methods of the paper. Where the answer comes from: Statistical analysis section, "the independent t-test". The quantile regression in Table 4 is a sensitivity analysis.
decision card Assume equal variances (unpaired t-test)
False gives the Welch test. It does not assume equal variances. True gives the Student test. Student's test is correct only if the group variances are equal. The model wants to run compare_two_groups.
Options: yes no
Suggested: false (This is the adapter default.)
Answer true
No person answered in this run. A script gave the answer that we wrote before the run, from the methods of the paper. Where the answer comes from: Not stated in the paper. The paper used Stata 16.1, whose ttest command assumes equal variances by default. The Student test reproduces the printed upper bound for 25(OH)D (26.4). The Welch test gives 26.5.
decision card Sidedness
Two-sided tests for a difference in either direction. One-sided tests for one direction only (the second group greater than the first, or less). Choose a one-sided test only if the other direction is not of interest, and decide before you see the data. The model wants to run compare_two_groups.
Options: two-sided greater less
Suggested: two-sided (This is the adapter default.)
Answer two-sided
No person answered in this run. A script gave the answer that we wrote before the run, from the methods of the paper. Where the answer comes from: Sample size calculation section, "a 2-sided significance level of 5%".
step n2 compare_two_groups adapter biostats 0.2.0, statsmodels, pingouin, lifelines 0.30.3
Student t-test (equal variances), two-sided: vitamin_d minus placebo = 23.09, statistic 13.72, p = 6.616e-22 (alpha 0.05).
Decisions applied: Significance level = 0.05; Paired or unpaired test = false; Test family for two groups = t; Equal variances for an unpaired test = true; Sidedness = two-sided.
Input file: {data}/sriphoosanaphan2021-vitd-hcv/vitd_hcv.csv SHA-256 0a0861006d85.
Outputs: two_group_test.csv (1c3c06d39752).
Arguments
| path | {data}/sriphoosanaphan2021-vitd-hcv/vitd_hcv.csv |
| outcome | VD_change |
| group | arm |
| paired | false |
| test | t |
| equal_variance | true |
| alternative | two-sided |
| alpha | 0.05 |
Tool output
{
 "ok": true,
 "summary": "Student t-test (equal variances), two-sided: vitamin_d minus placebo = 23.09, statistic 13.72, p = 6.616e-22 (alpha 0.05).",
 "metrics": {
  "n_a": 38,
  "n_b": 37,
  "mean_diff": 23.086415362731152,
  "statistic": 13.723934695158828,
  "df": 73,
  "p_value": 6.615861523019445e-22,
  "ci_lo": 19.733793794132957,
  "ci_hi": 26.439036931329348,
  "effect_size": 3.1696887188680014,
  "mean_a": 1.4973684210526317,
  "mean_b": 24.583783783783783
 },
 "data": {
  "test": "Student t-test (equal variances)",
  "alternative": "two-sided",
  "direction": "vitamin_d minus placebo",
  "alpha": 0.05,
  "significant": true
 },
 "table": {
  "columns": [
   "test",
   "group_a",
   "group_b",
   "n_a",
   "n_b",
   "mean_diff_b_minus_a",
   "statistic",
   "df",
   "p",
   "ci_lo",
   "ci_hi",
   "cohen_d"
  ],
  "rows": [
   [
    "Student t-test (equal variances)",
    "placebo",
    "vitamin_d",
    38,
    37,
    23.086415362731152,
    13.723934695158828,
    73,
    6.615861523019445e-22,
    19.733793794132957,
    26.439036931329348,
    3.1696887188680014
   ]
  ],
  "n_rows": 1,
  "path": "{work}/compare_two_groups-1/two_group_test.csv"
 }
}compare_two_groups (adapter biostats).step n3 compare_two_groups adapter biostats 0.2.0, statsmodels, pingouin, lifelines 0.30.3
Student t-test (equal variances), two-sided: vitamin_d minus placebo = -0.5543, statistic -0.4835, p = 0.6302 (alpha 0.05).
Decisions applied: Significance level = 0.05; Paired or unpaired test = false; Test family for two groups = t; Equal variances for an unpaired test = true; Sidedness = two-sided.
Input file: {data}/sriphoosanaphan2021-vitd-hcv/vitd_hcv.csv SHA-256 0a0861006d85.
Outputs: two_group_test.csv (2e41cd1d41ee).
Arguments
| path | {data}/sriphoosanaphan2021-vitd-hcv/vitd_hcv.csv |
| outcome | TGF_change |
| group | arm |
| alpha | 0.05 |
| paired | false |
| test | t |
| equal_variance | true |
| alternative | two-sided |
Tool output
{
 "ok": true,
 "summary": "Student t-test (equal variances), two-sided: vitamin_d minus placebo = -0.5543, statistic -0.4835, p = 0.6302 (alpha 0.05).",
 "metrics": {
  "n_a": 38,
  "n_b": 37,
  "mean_diff": -0.5542816500711234,
  "statistic": -0.4834523278183658,
  "df": 73,
  "p_value": 0.6302215677645985,
  "ci_lo": -2.8392675151930034,
  "ci_hi": 1.7307042150507568,
  "effect_size": -0.11165845827996448,
  "mean_a": 1.0315789473684207,
  "mean_b": 0.4772972972972973
 },
 "data": {
  "test": "Student t-test (equal variances)",
  "alternative": "two-sided",
  "direction": "vitamin_d minus placebo",
  "alpha": 0.05,
  "significant": false
 },
 "table": {
  "columns": [
   "test",
   "group_a",
   "group_b",
   "n_a",
   "n_b",
   "mean_diff_b_minus_a",
   "statistic",
   "df",
   "p",
   "ci_lo",
   "ci_hi",
   "cohen_d"
  ],
  "rows": [
   [
    "Student t-test (equal variances)",
    "placebo",
    "vitamin_d",
    38,
    37,
    -0.5542816500711234,
    -0.4834523278183658,
    73,
    0.6302215677645985,
    -2.8392675151930034,
    1.7307042150507568,
    -0.11165845827996448
   ]
  ],
  "n_rows": 1,
  "path": "{work}/compare_two_groups-2/two_group_test.csv"
 }
}compare_two_groups (adapter biostats).step n4 compare_two_groups adapter biostats 0.2.0, statsmodels, pingouin, lifelines 0.30.3
Student t-test (equal variances), two-sided: vitamin_d minus placebo = -5.51, statistic -0.5267, p = 0.6 (alpha 0.05).
Decisions applied: Significance level = 0.05; Paired or unpaired test = false; Test family for two groups = t; Equal variances for an unpaired test = true; Sidedness = two-sided.
Input file: {data}/sriphoosanaphan2021-vitd-hcv/vitd_hcv.csv SHA-256 0a0861006d85.
Outputs: two_group_test.csv (b8630da84ac0).
Arguments
| path | {data}/sriphoosanaphan2021-vitd-hcv/vitd_hcv.csv |
| outcome | TIMP_change |
| group | arm |
| alpha | 0.05 |
| paired | false |
| test | t |
| equal_variance | true |
| alternative | two-sided |
Tool output
{
 "ok": true,
 "summary": "Student t-test (equal variances), two-sided: vitamin_d minus placebo = -5.51, statistic -0.5267, p = 0.6 (alpha 0.05).",
 "metrics": {
  "n_a": 38,
  "n_b": 37,
  "mean_diff": -5.5101564722617375,
  "statistic": -0.5266719021952267,
  "df": 73,
  "p_value": 0.6000181795891157,
  "ci_lo": -26.361327697929894,
  "ci_hi": 15.34101475340642,
  "effect_size": -0.12164047877041008,
  "mean_a": 12.624210526315792,
  "mean_b": 7.114054054054055
 },
 "data": {
  "test": "Student t-test (equal variances)",
  "alternative": "two-sided",
  "direction": "vitamin_d minus placebo",
  "alpha": 0.05,
  "significant": false
 },
 "table": {
  "columns": [
   "test",
   "group_a",
   "group_b",
   "n_a",
   "n_b",
   "mean_diff_b_minus_a",
   "statistic",
   "df",
   "p",
   "ci_lo",
   "ci_hi",
   "cohen_d"
  ],
  "rows": [
   [
    "Student t-test (equal variances)",
    "placebo",
    "vitamin_d",
    38,
    37,
    -5.5101564722617375,
    -0.5266719021952267,
    73,
    0.6000181795891157,
    -26.361327697929894,
    15.34101475340642,
    -0.12164047877041008
   ]
  ],
  "n_rows": 1,
  "path": "{work}/compare_two_groups-3/two_group_test.csv"
 }
}compare_two_groups (adapter biostats).step n5 compare_two_groups adapter biostats 0.2.0, statsmodels, pingouin, lifelines 0.30.3
Student t-test (equal variances), two-sided: vitamin_d minus placebo = 122.9, statistic 1.277, p = 0.2058 (alpha 0.05).
Decisions applied: Significance level = 0.05; Paired or unpaired test = false; Test family for two groups = t; Equal variances for an unpaired test = true; Sidedness = two-sided.
Input file: {data}/sriphoosanaphan2021-vitd-hcv/vitd_hcv.csv SHA-256 0a0861006d85.
Outputs: two_group_test.csv (22aead36c356).
Arguments
| path | {data}/sriphoosanaphan2021-vitd-hcv/vitd_hcv.csv |
| outcome | MMP_change |
| group | arm |
| alpha | 0.05 |
| paired | false |
| test | t |
| equal_variance | true |
| alternative | two-sided |
Tool output
{
 "ok": true,
 "summary": "Student t-test (equal variances), two-sided: vitamin_d minus placebo = 122.9, statistic 1.277, p = 0.2058 (alpha 0.05).",
 "metrics": {
  "n_a": 38,
  "n_b": 37,
  "mean_diff": 122.92064722617353,
  "statistic": 1.2767027662855421,
  "df": 73,
  "p_value": 0.20575360709572219,
  "ci_lo": -68.96465537016569,
  "ci_hi": 314.80594982251273,
  "effect_size": 0.2948680859775849,
  "mean_a": -14.856052631578953,
  "mean_b": 108.06459459459458
 },
 "data": {
  "test": "Student t-test (equal variances)",
  "alternative": "two-sided",
  "direction": "vitamin_d minus placebo",
  "alpha": 0.05,
  "significant": false
 },
 "table": {
  "columns": [
   "test",
   "group_a",
   "group_b",
   "n_a",
   "n_b",
   "mean_diff_b_minus_a",
   "statistic",
   "df",
   "p",
   "ci_lo",
   "ci_hi",
   "cohen_d"
  ],
  "rows": [
   [
    "Student t-test (equal variances)",
    "placebo",
    "vitamin_d",
    38,
    37,
    122.92064722617353,
    1.2767027662855421,
    73,
    0.20575360709572219,
    -68.96465537016569,
    314.80594982251273,
    0.2948680859775849
   ]
  ],
  "n_rows": 1,
  "path": "{work}/compare_two_groups-4/two_group_test.csv"
 }
}compare_two_groups (adapter biostats).step n6 compare_two_groups adapter biostats 0.2.0, statsmodels, pingouin, lifelines 0.30.3
Student t-test (equal variances), two-sided: vitamin_d minus placebo = -0.1104, statistic -0.09728, p = 0.9228 (alpha 0.05).
Decisions applied: Significance level = 0.05; Paired or unpaired test = false; Test family for two groups = t; Equal variances for an unpaired test = true; Sidedness = two-sided.
Input file: {data}/sriphoosanaphan2021-vitd-hcv/vitd_hcv.csv SHA-256 0a0861006d85.
Outputs: two_group_test.csv (9948aa5ebec9).
Arguments
| path | {data}/sriphoosanaphan2021-vitd-hcv/vitd_hcv.csv |
| outcome | P3NP_change |
| group | arm |
| alpha | 0.05 |
| paired | false |
| test | t |
| equal_variance | true |
| alternative | two-sided |
Tool output
{
 "ok": true,
 "summary": "Student t-test (equal variances), two-sided: vitamin_d minus placebo = -0.1104, statistic -0.09728, p = 0.9228 (alpha 0.05).",
 "metrics": {
  "n_a": 38,
  "n_b": 37,
  "mean_diff": -0.11039118065433862,
  "statistic": -0.0972833983817803,
  "df": 73,
  "p_value": 0.9227679456807509,
  "ci_lo": -2.371920993832504,
  "ci_hi": 2.151138632523827,
  "effect_size": -0.0224686357982048,
  "mean_a": -0.8144736842105262,
  "mean_b": -0.9248648648648649
 },
 "data": {
  "test": "Student t-test (equal variances)",
  "alternative": "two-sided",
  "direction": "vitamin_d minus placebo",
  "alpha": 0.05,
  "significant": false
 },
 "table": {
  "columns": [
   "test",
   "group_a",
   "group_b",
   "n_a",
   "n_b",
   "mean_diff_b_minus_a",
   "statistic",
   "df",
   "p",
   "ci_lo",
   "ci_hi",
   "cohen_d"
  ],
  "rows": [
   [
    "Student t-test (equal variances)",
    "placebo",
    "vitamin_d",
    38,
    37,
    -0.11039118065433862,
    -0.0972833983817803,
    73,
    0.9227679456807509,
    -2.371920993832504,
    2.151138632523827,
    -0.0224686357982048
   ]
  ],
  "n_rows": 1,
  "path": "{work}/compare_two_groups-5/two_group_test.csv"
 }
}
Model thinking, summary: I'm confirming the group assignments—placebo is group a (n=38) and vitamin D is group b (n=37)—and computing the difference as vitamin D minus placebo. Since I'm testing four markers simultaneously, I need to decide whether to apply a multiple comparisons correction like Holm's method.
Model
The four marker tests answer one question. I now adjust their p-values for multiple comparisons.
adjust_pvalues (adapter biostats).paused The harness paused adjust_pvalues until the scientist chose: Correction for a list of p-values. The decision cards follow.
decision card Correction for a list of p-values
Use this when you ran many tests. Bonferroni, Holm and Sidak control the chance of any false positive. fdr_bh and fdr_by control the share of false positives among the positives. The model wants to run adjust_pvalues.
Options: bonferroni holm sidak fdr_bh fdr_by
Suggested: holm (This is the adapter default.)
Answer holm
No person answered in this run. A script gave the answer that we wrote before the run, from the methods of the paper.
step n7 adjust_pvalues adapter biostats 0.2.0, statsmodels, pingouin, lifelines 0.30.3
holm correction of 4 p-values at alpha 0.05: 0 rejected.
Decisions applied: Significance level = 0.05; Correction for a list of p-values = holm.
Outputs: adjusted_p.csv (12e04b44cd0f).
Arguments
| pvalues | [0.6302215677645985,0.6000181795891157,0.20575360709572219,0.9227679456807509] |
| method | holm |
| alpha | 0.05 |
Tool output
{
 "ok": true,
 "summary": "holm correction of 4 p-values at alpha 0.05: 0 rejected.",
 "metrics": {
  "n_tests": 4,
  "n_rejected": 0
 },
 "table": {
  "columns": [
   "p_raw",
   "p_adjusted",
   "reject"
  ],
  "rows": [
   [
    0.6302215677645985,
    1,
    false
   ],
   [
    0.6000181795891157,
    1,
    false
   ],
   [
    0.20575360709572219,
    0.8230144283828887,
    false
   ],
   [
    0.9227679456807509,
    1,
    false
   ]
  ],
  "n_rows": 4,
  "path": "{work}/adjust_pvalues-1/adjusted_p.csv"
 }
}read_file.Result of read_file: Read 156 of 156 bytes from {work}/adjust_pvalues-1/adjusted_p.csv.
p_raw,p_adjusted,reject
0.6302215677645985,1.0,False
0.6000181795891157,1.0,False
0.20575360709572219,0.8230144283828887,False
0.9227679456807509,1.0,False
Model Answer draft 1. The claim check and the review read it.
What I did
The data hold 75 patients, one row each, with no missing values. There were 37 patients on vitamin D and 38 on placebo. Each patient is one replicate.
I ran an unpaired Student t-test (equal variances, two-sided, alpha 0.05) on each change-from-baseline column. The arms are independent groups. The difference is vitamin D minus placebo. The effect size is Cohen's d. The step was compare_two_groups.
I then adjusted the four marker p-values with the Holm correction (adjust_pvalues). The 25(OH)D test is a separate primary question, so I left it out of that set.
What I found
| Outcome | Mean change, vitamin D | Mean change, placebo | Difference (vitamin D minus placebo) | 95% CI | Raw p | Holm-adjusted p | Cohen's d |
|---|---|---|---|---|---|---|---|
| 25(OH)D (ng/mL) | 24.58 | 1.50 | 23.09 | 19.73 to 26.44 | 6.6e-22 | not applicable | 3.17 |
| TGF-beta1 (ng/mL) | 0.48 | 1.03 | -0.55 | -2.84 to 1.73 | 0.630 | 1.0 | -0.11 |
| TIMP-1 (ng/mL) | 7.11 | 12.62 | -5.51 | -26.36 to 15.34 | 0.600 | 1.0 | -0.12 |
| MMP-9 (ng/mL) | 108.06 | -14.86 | 122.92 | -68.96 to 314.81 | 0.206 | 0.823 | 0.29 |
| P3NP (ng/mL) | -0.92 | -0.81 | -0.11 | -2.37 to 2.15 | 0.923 | 1.0 | -0.02 |
The vitamin D mean changes come from the group labelled b in the tool output. The placebo means come from a.
- 25(OH)D: Vitamin D raised the mean change by 23.09 ng/mL more than placebo. The test statistic was t = 13.72 with 73 degrees of freedom (df). This is significant at alpha 0.05.
- Fibrosis markers: None of the four markers differed from placebo at alpha 0.05, before or after the Holm correction. The Holm test rejected 0 of 4.
What is uncertain
- The marker confidence intervals are wide. MMP-9 has the widest, from -68.96 to 314.81 ng/mL. A small effect on any marker cannot be ruled out with 75 patients. A non-significant result does not show that vitamin D has no effect.
- I did not check normality or equal variances. MMP-9 changes range from -2176.83 to 1451.45 ng/mL, so the equal-variance t-test may fit poorly for this marker. A rank test or Welch test would show whether this matters.
- The tests do not adjust for baseline values or other covariates.
- The follow-up was 6 weeks, so the data say nothing about longer-term effects.
What waits for the scientist
- Decide whether to run a Welch or rank-test check, mainly for MMP-9.
- Confirm that the Holm correction over the four markers is the family you want. The test choices were filled in by the harness.
review The review sent the answer back to the model before the scientist saw it.
- 1 number in the answer match no logged tool result: -2176.83. Run the tool that measures each number, or remove the number, or say how you derived it from logged results.
- The answer says MMP-9 changes range from -2176.83 to 1451.45 ng/mL. No logged step produced the lower value. No step computed a range of MMP-9 changes at all. The answer uses this range to doubt the t-test, so the doubt rests on an unsupported number.
Fix these problems. Then give the answer again.
Model
The range came from the column summary in inspect_table, which I read from columns.csv. I now recompute it with a script, split by arm, so a logged step supports it.
The model runs run_script.
import pandas as pd
from ga_api import save_table
df = pd.read_csv('{data}/sriphoosanaphan2021-vitd-hcv/vitd_hcv.csv')
rows=[]
for name,g in [('all',df)]+list(df.groupby('arm')):
    s=g['MMP_change']
    rows.append(dict(group=name,n=len(s),min=s.min(),max=s.max(),sd=s.std(),mean=s.mean()))
t=pd.DataFrame(rows); print(t.to_string()); save_table('mmp_change_range',t.to_dict('records'))run_script. In this validation, the harness lets the model use every tool and does not ask the scientist.step n8 run_script
The script ran in {work} and wrote 1 new file(s) to {work}.
Outputs: mmp_change_range.csv (9353fe48bfb7).
Arguments
| purpose | Measure the range and spread of MMP-9 change in each arm |
| does | Reads the data file and reports the count, minimum, maximum and standard deviation of MMP_change for the whole sample and for each arm. Saves a table. |
| code | import pandas as pd
from ga_api import save_table
df = pd.read_csv('{data}/sriphoosanaphan2021-vitd-hcv/vitd_hcv.csv')
rows=[]
for name,g in [('all',df)]+list(df.groupby('arm')):
s=g['MMP_change']
rows.append(dict(group=name,n=len(s),min=s.min(),max=s.max(),sd=s.std(),mean=s.mean()))
t=pd.DataFrame(rows); print(t.to_string()); save_table('mmp_change_range',t.to_dict('records')) |
Tool output
       group   n      min      max          sd        mean
0        all  75 -2176.83  1451.45  418.637223   45.784800
1    placebo  38 -2176.83   557.92  417.140934  -14.856053
2  vitamin_d  37  -518.04  1451.45  416.584394  108.064595
Model The model writes its answer. The claim check reads it. See the final answer.
The final answer
The model wrote this answer. The harness shows it to the scientist after the review.
What I did
The data hold 75 patients, one row each, with no missing values. There were 37 patients on vitamin D and 38 on placebo. Each patient is one replicate.
I ran an unpaired Student t-test (equal variances, two-sided, alpha 0.05) on each change-from-baseline column. The arms are independent groups. The difference is vitamin D minus placebo. The effect size is Cohen's d. The step was compare_two_groups.
I then adjusted the four marker p-values with the Holm correction (adjust_pvalues). The 25(OH)D test is a separate primary question, so I left it out of that set.
What I found
| Outcome | Mean change, vitamin D | Mean change, placebo | Difference (vitamin D minus placebo) | 95% CI | Raw p | Holm-adjusted p | Cohen's d |
|---|---|---|---|---|---|---|---|
| 25(OH)D (ng/mL) | 24.58 | 1.50 | 23.09 | 19.73 to 26.44 | 6.6e-22 | not applicable | 3.17 |
| TGF-beta1 (ng/mL) | 0.48 | 1.03 | -0.55 | -2.84 to 1.73 | 0.630 | 1.0 | -0.11 |
| TIMP-1 (ng/mL) | 7.11 | 12.62 | -5.51 | -26.36 to 15.34 | 0.600 | 1.0 | -0.12 |
| MMP-9 (ng/mL) | 108.06 | -14.86 | 122.92 | -68.96 to 314.81 | 0.206 | 0.823 | 0.29 |
| P3NP (ng/mL) | -0.92 | -0.81 | -0.11 | -2.37 to 2.15 | 0.923 | 1.0 | -0.02 |
- 25(OH)D: Vitamin D raised the mean change by 23.09 ng/mL more than placebo. The test statistic was t = 13.72 with 73 degrees of freedom. This is significant at alpha 0.05.
- Fibrosis markers: None of the four markers differed from placebo at alpha 0.05, before or after the Holm correction. The Holm test rejected 0 of 4.
MMP-9 spread, from the new script
I removed my earlier claim about unequal variances. It was wrong, and I had not measured it. A script on the MMP-9 change gave these values:
| Group | n | Minimum (ng/mL) | Maximum (ng/mL) | Standard deviation (ng/mL) |
|---|---|---|---|---|
| All patients | 75 | -2176.83 | 1451.45 | 418.64 |
| Placebo | 38 | -2176.83 | 557.92 | 417.14 |
| Vitamin D | 37 | -518.04 | 1451.45 | 416.58 |
- The standard deviations of the two arms are almost equal, so the equal-variance assumption looks reasonable for MMP-9.
- The placebo minimum of -2176.83 ng/mL is far below the rest of the range. It is an extreme value. I did not remove it, and I did not test how much it changes the result.
What is uncertain
- The marker confidence intervals are wide. MMP-9 has the widest, from -68.96 to 314.81 ng/mL. A small effect on any marker cannot be ruled out with 75 patients. A non-significant result does not show that vitamin D has no effect.
- I did not check normality. The extreme MMP-9 value can affect the mean difference. A rank test would show whether it matters.
- The tests do not adjust for baseline values or other covariates.
- The follow-up was 6 weeks, so the data say nothing about longer-term effects.
What waits for the scientist
- Decide whether to run a rank-test check, mainly for MMP-9 because of the extreme value.
- Confirm that the Holm correction over the four markers is the family you want. The test choices were filled in by the harness.
Settings and step results that the answer does not mention. The harness adds them.
Step results that the answer does not mention, from the record:
- n8 run_script: The script ran in {work} and wrote 1 new file(s) to {work}.

Settings used, from the decision record: Significance level (alpha): 0.05 · Paired test: false · Test family for two groups: t · Assume equal variances (unpaired t-test): true · Sidedness: two-sided · Correction for a list of p-values: holm.
Values that are not scored
- A trap value is the result of a wrong method, for example an unpaired test on paired data. A trap value in a main step means that the run used the wrong method. A trap value in a comparison run is correct, because the record keeps the scientist's choice.
- An optional value is a second result of the same method. The run can compute it or not.
- A reference value comes from a different program version or a check run by us. We show it for comparison.
| Item | Kind | Known value | Closest logged value | Tolerance | Outcome | Source of the known value |
|---|---|---|---|---|---|---|
mmp_week6_trapMMP-9 at week 6 only, vitamin D minus placebo (trap result) | trap | 129.06 | 122.9206n5 compare_two_groups | ± 0.05 | not in the record | We calculated it with SciPy ttest_ind with equal_var=True on MMP6 |
Checks
Review findings
The review recorded 7 findings. A rule finding comes from a fixed check in the harness. A referee finding comes from a second model that reads the record. The harness shows the findings to the scientist with the final answer. The record does not mark a finding as fixed. Thus a finding from an early review round can apply to a draft that the model corrected later.
| Severity | From | Finding | Shown with the final answer |
|---|---|---|---|
| warning | ruleid_column_missing | Name the subject column. A test with no subject column cannot warn that the same subjects are in both groups. | yes |
| info | ruletext_style | The answer breaks the text rules (ASD-STE100) in 2 places. Sentence 29 uses the passive voice: "be ruled". Use the active voice. Sentence 39 uses the passive voice: "were filled". Use the active voice. | yes |
| warning | referee model | The Holm family was chosen by the analyst, not the scientist. The answer leaves 25(OH)D out of the correction because it is 'a separate primary question'. The log shows no scientist decision on this. The answer asks for confirmation only at the end. | yes |
| warning | referee model | The answer says the harness filled in the test choices. The log shows the scientist answered paired, test family, equal variance, sidedness and correction method. The statement misdescribes who made the method choices. | yes |
| info | referee model | The answer says the placebo minimum is far below the rest of the range. The script reported only min, max, sd and mean, so the second-lowest value is not logged. The outlier effect on the t-test was not tested. | yes |
| info | referee model | The equal-variance check covers only MMP-9. The other markers kept the Student test with no logged spread check. The answer refers to an earlier unequal-variance claim that is not in the log. | yes |
| info | referee model | The answer says there are no missing values in the data. The inspect_table output shows only the first 15 of 31 columns. The change columns (VD_change and others) are not visible and their origin is not logged. The no-missing claim is not fully checked for them. | yes |
Numbers in the answer
The last claim check read 74 numbers in the answer. 74 numbers match a logged result. 0 numbers have no source in the record.
Deviations
The model did not try to change a choice of the scientist.
Failed tool calls
No tool call failed.
Data integrity
Each data file has the same SHA-256 hash now as at the time of the step that read it. Where the download script (fetch.sh) gives a hash, the file also has that hash. The run did not change the data.
| File | SHA-256 | Fetched data | Steps with this hash |
|---|---|---|---|
{data}/sriphoosanaphan2021-vitd-hcv/vitd_hcv.csv11.8 KB | 0a0861006d85 | same as the hash in the download script (fetch.sh) | n1, n2, n3, n4, n5, n6 |
A SHA-256 hash is a fingerprint of the file contents. If one byte of the file changes, the hash changes. The table shows the first 12 characters.
How to repeat it
Get the data. The script downloads the files and checks their SHA-256 hashes where it lists them.
CUVETTE_DATA={data} bash bench/papers/sriphoosanaphan2021-vitd-hcv/fetch.shRun the same case with Cuvette. The script gives the same answers from bench/papers/sriphoosanaphan2021-vitd-hcv/bench.yaml.
cuvette bench papers --papers sriphoosanaphan2021-vitd-hcv --models claude:claude-sonnet-5-5
Repeat each step by hand in the program. For each step, the harness records a manual route: the menu path or the code that gives the same result. This list does not include comparison runs.
inspect_table(step n1)Code
print(pd.read_csv(path).describe(include='all'))path
{data}/sriphoosanaphan2021-vitd-hcv/vitd_hcv.csv- Note: The tool also counts distinct values and missing values for each column.
The manual route that the harness recorded
ga_biostats.inspect_table(path="{data}/sriphoosanaphan2021-vitd-hcv/vitd_hcv.csv")The manual route uses the same method. The note in the route gives the known difference.
compare_two_groups(step n2)Code
scipy.stats.ttest_ind(x, y, equal_var=False) # Welch. equal_var=True is Student. scipy.stats.mannwhitneyu(x, y) # rank test- equal_var =
true - alternative =
two-sided
The manual route that the harness recorded
ga_biostats.compare_two_groups(path="{data}/sriphoosanaphan2021-vitd-hcv/vitd_hcv.csv", outcome="VD_change", group="arm", test="t", paired=False, alternative="two-sided", alpha=0.05, equal_variance=True)The manual route gives the same numbers. An automatic test in Cuvette checks this.
- equal_var =
compare_two_groups(step n3)Code
scipy.stats.ttest_ind(x, y, equal_var=False) # Welch. equal_var=True is Student. scipy.stats.mannwhitneyu(x, y) # rank test- equal_var =
true - alternative =
two-sided
The manual route that the harness recorded
ga_biostats.compare_two_groups(path="{data}/sriphoosanaphan2021-vitd-hcv/vitd_hcv.csv", outcome="TGF_change", group="arm", test="t", paired=False, alternative="two-sided", alpha=0.05, equal_variance=True)The manual route gives the same numbers. An automatic test in Cuvette checks this.
- equal_var =
compare_two_groups(step n4)Code
scipy.stats.ttest_ind(x, y, equal_var=False) # Welch. equal_var=True is Student. scipy.stats.mannwhitneyu(x, y) # rank test- equal_var =
true - alternative =
two-sided
The manual route that the harness recorded
ga_biostats.compare_two_groups(path="{data}/sriphoosanaphan2021-vitd-hcv/vitd_hcv.csv", outcome="TIMP_change", group="arm", test="t", paired=False, alternative="two-sided", alpha=0.05, equal_variance=True)The manual route gives the same numbers. An automatic test in Cuvette checks this.
- equal_var =
compare_two_groups(step n5)Code
scipy.stats.ttest_ind(x, y, equal_var=False) # Welch. equal_var=True is Student. scipy.stats.mannwhitneyu(x, y) # rank test- equal_var =
true - alternative =
two-sided
The manual route that the harness recorded
ga_biostats.compare_two_groups(path="{data}/sriphoosanaphan2021-vitd-hcv/vitd_hcv.csv", outcome="MMP_change", group="arm", test="t", paired=False, alternative="two-sided", alpha=0.05, equal_variance=True)The manual route gives the same numbers. An automatic test in Cuvette checks this.
- equal_var =
compare_two_groups(step n6)Code
scipy.stats.ttest_ind(x, y, equal_var=False) # Welch. equal_var=True is Student. scipy.stats.mannwhitneyu(x, y) # rank test- equal_var =
true - alternative =
two-sided
The manual route that the harness recorded
ga_biostats.compare_two_groups(path="{data}/sriphoosanaphan2021-vitd-hcv/vitd_hcv.csv", outcome="P3NP_change", group="arm", test="t", paired=False, alternative="two-sided", alpha=0.05, equal_variance=True)The manual route gives the same numbers. An automatic test in Cuvette checks this.
- equal_var =
adjust_pvalues(step n7)Code
statsmodels.stats.multitest.multipletests(pvals, alpha=0.05, method='holm')- method =
holm - Warning: If you keep the default hs, you get a different result.
The manual route that the harness recorded
ga_biostats.adjust_pvalues(pvalues=[0.6302215677645985, 0.6000181795891157, 0.20575360709572219, 0.9227679456807509], method="holm", alpha=0.05)The manual route gives the same numbers. An automatic test in Cuvette checks this.
- method =
run_script(step n8)Run the Python code in {work}/script-1/script.py
- Code only: this step has no route in the program menus. Run it with the script or flow export.
The program has no menu route for this step. To repeat it, run the code.
Figure
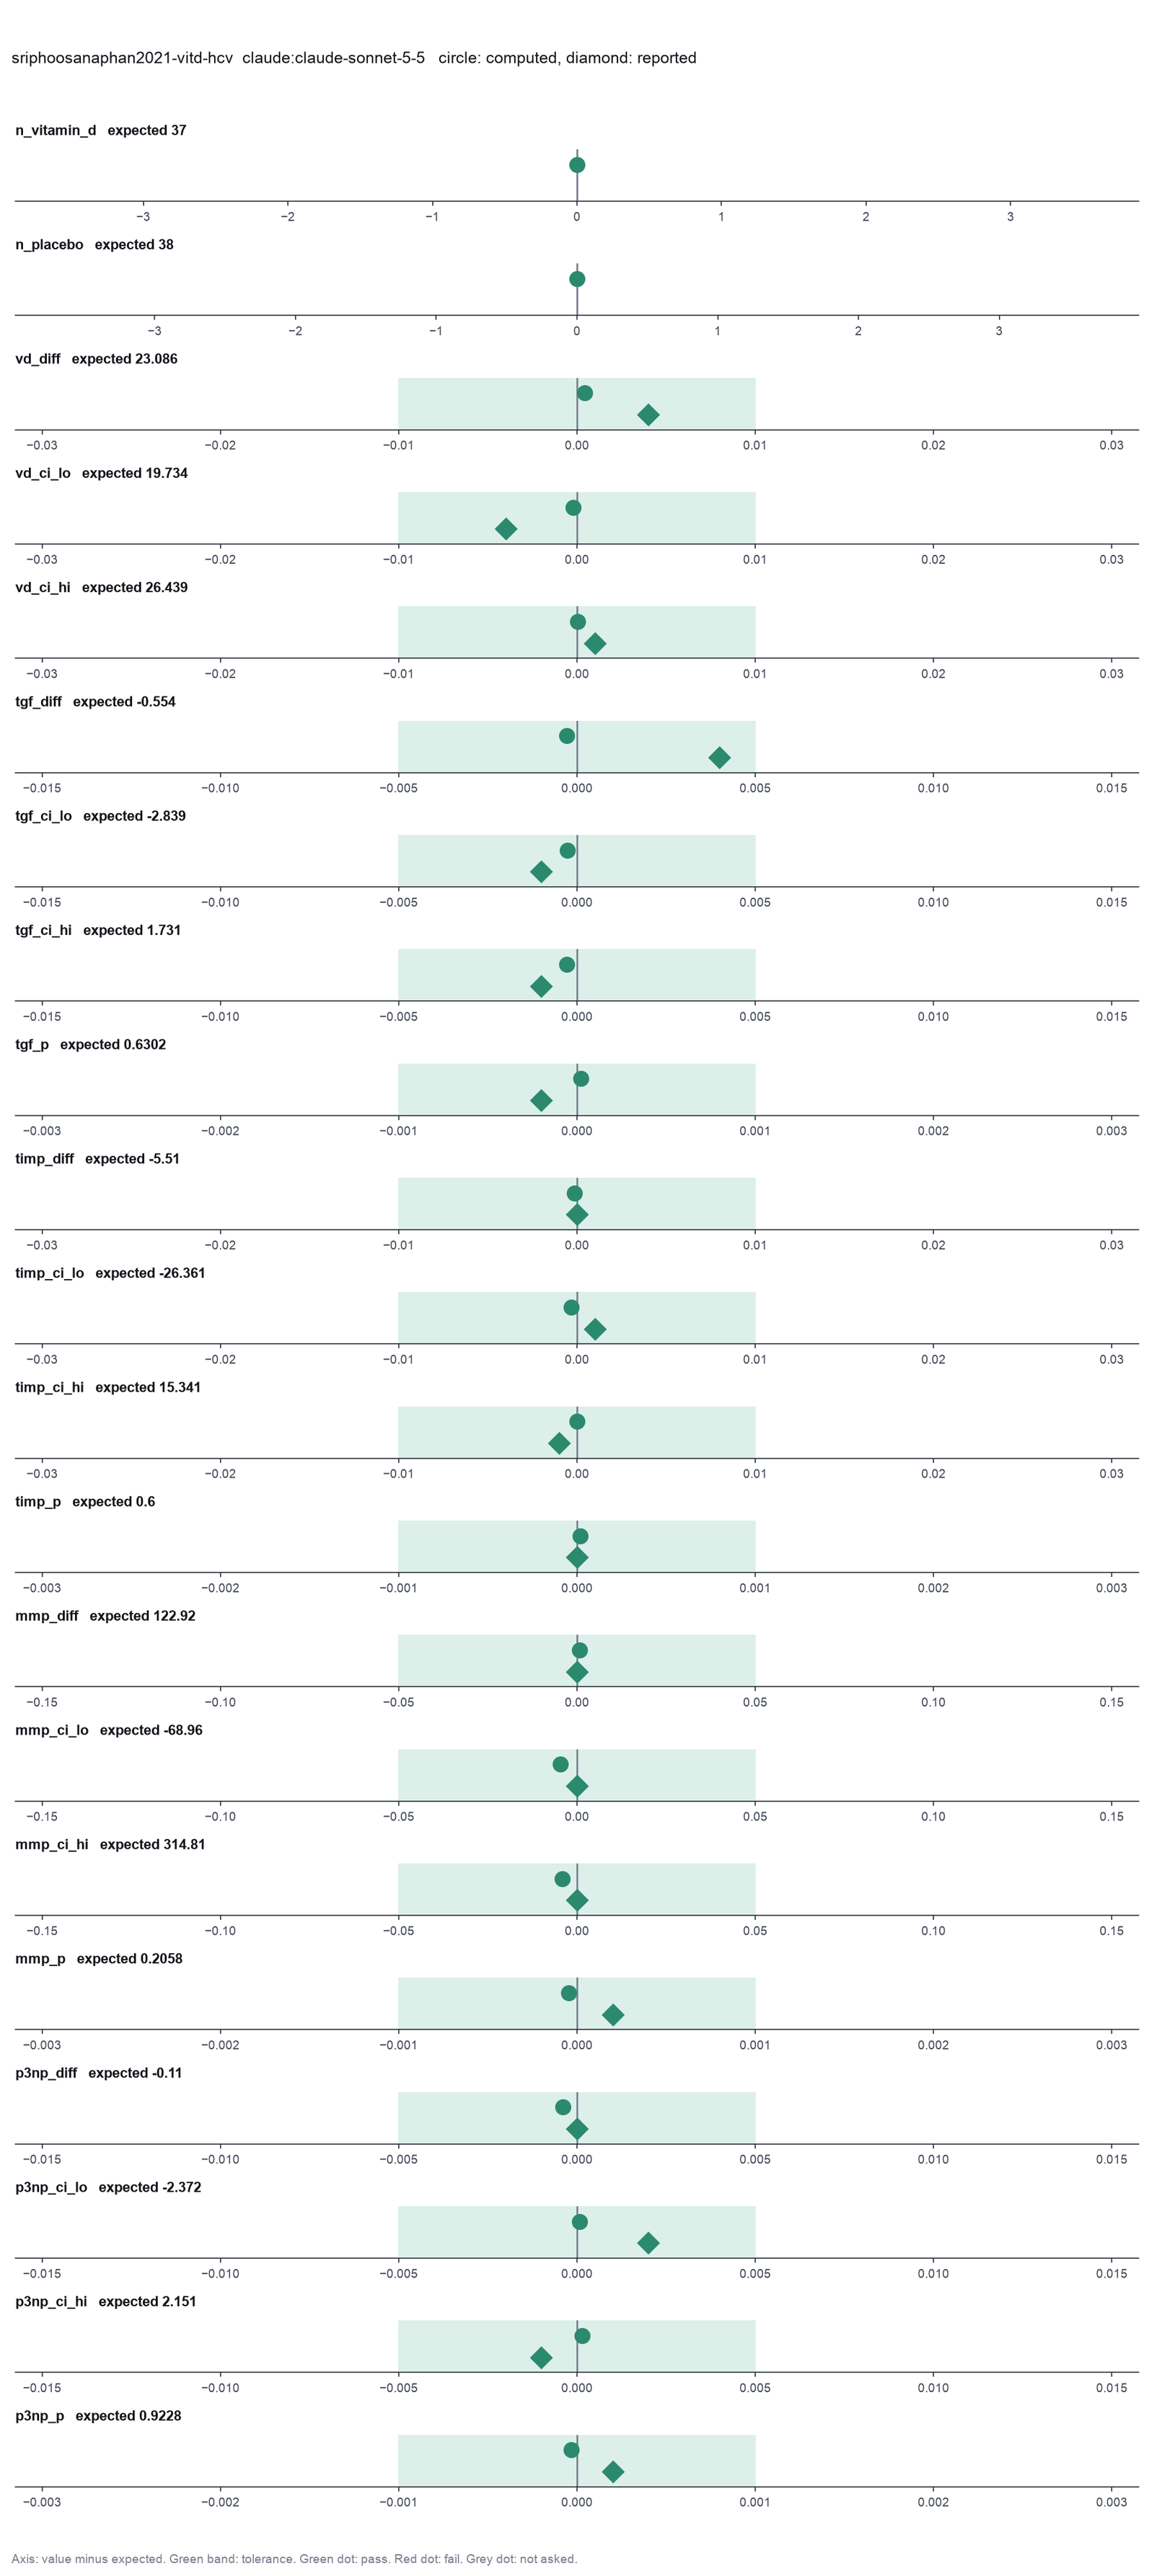
Run facts
| Model | claude-sonnet-5-5 through the Anthropic service |
| Date | 2026-10-09 11:34:04 UTC |
| End of run | the model gave a final answer |
| Time | 69 s |
| Requests to the model | 8 |
| Tokensunits of text that the model read and wrote | 20 input, 4499 output, 153366 cache read, 27557 cache write |
| Cost estimate | $0.14 at list price, from the token counts |
| Tool calls | 10 (0 failed) |
| Adapters | biostats 0.2.0, program 0.30.3 |
| Session | 20261009-063404-2ec7 |
Code hash of each step (8)
| Step | Tool | Program version | Code hash |
|---|---|---|---|
| n1 | inspect_table | 0.30.3 | 603f546a1fe4 |
| n2 | compare_two_groups | 0.30.3 | 1ad4cb82ccf4 |
| n3 | compare_two_groups | 0.30.3 | 1ad4cb82ccf4 |
| n4 | compare_two_groups | 0.30.3 | 1ad4cb82ccf4 |
| n5 | compare_two_groups | 0.30.3 | 1ad4cb82ccf4 |
| n6 | compare_two_groups | 0.30.3 | 1ad4cb82ccf4 |
| n7 | adjust_pvalues | 0.30.3 | 6cce9d622e70 |
| n8 | run_script | - | 995d74a3af3a |
The code hash is a fingerprint of the adapter name, the adapter version, the tool and its definition in the adapter. If one of these changes, the hash changes.
Haiku · claude-haiku-5-5 · run 3 of 3 shown 21 of 21 values match, 19 of 19 correct in the final answer
The session
This is the session as the scientist sees it, in order. Decision cards show the answer that the script gave and where that answer comes from. Each step shows the program, its version, the input file hash and the outputs. Click a line to see more.
setup The decision record starts with these values. A script set them before the first message, from the answers that we wrote before the run.
- Unit of replication: subjects, patients or animals (one value per subject)Where the answer comes from: Patient characteristics section. Each of the 75 randomized patients gives one change for each marker.
- Significance level: 0.05Where the answer comes from: Sample size calculation section. The trial used a two-sided significance level of 5%.
harness note A note from the harness to the model. The scientist did not write it.
- Setup values:
Design:
- What is the unit of replication? (replicate): subjects, patients or animals (one value per subject)
Inference:
- Significance level (alpha) (alpha): 0.05
Ask the scientist: Paired test (paired), Test family for two groups (two_group_test), Assume equal variances (unpaired t-test) (equal_variance), Sidedness (alternative), ANOVA variance assumption (anova_variance), Pairwise comparisons after ANOVA (posthoc), Correction for a list of p-values (p_adjust_method), Model formula (model_formula), Standard errors for the linear model (standard_errors), Random effects of the mixed model (random_effects), Fit by REML (reml), Covariates of the Cox model (cox_covariates), Ties method of the Cox model (ties), Strata of the Cox model (cox_strata), Type of sums of squares (ss_type), Comparisons of the cell means after a factorial ANOVA (factorial_posthoc), Sphericity correction for repeated measures (sphericity_correction), Correction after a rank test over many groups (rank_p_adjust), Exact or approximate p value for a rank test (exact_p), Covariates of the logistic model (logistic_covariates), Outcome value that counts as the event (logistic_event), Reference level of each categorical covariate (reference_levels), Yates continuity correction for a 2x2 chi-square test (chi_square_correction), Sidedness of the Fisher exact test (fisher_alternative), Method of the McNemar test (mcnemar_method).
The harness fills these values into your tool calls automatically. If you give a different value, the harness logs a deviation and shows it to the scientist.
- Mode is now watch: you run the steps.
Model thinking, summary: I'm starting by inspecting the table, keeping in mind the system prompt requires Simplified Technical English with short sentences and expanded acronyms. My plan is to compare two groups for each outcome measure—vessel density, TGF, TIMP, MMP, and P3NP changes—using an unpaired statistical test.
Model
I will start by checking the data file for columns, missing values and group sizes.
inspect_table (adapter biostats).step n1 inspect_table adapter biostats 0.2.0, statsmodels, pingouin, lifelines 0.30.3
75 rows x 31 columns.
Input file: {data}/sriphoosanaphan2021-vitd-hcv/vitd_hcv.csv SHA-256 0a0861006d85.
Outputs: columns.csv (e9df16101f7e).
Arguments
| path | {data}/sriphoosanaphan2021-vitd-hcv/vitd_hcv.csv |
Tool output
{
 "ok": true,
 "summary": "75 rows x 31 columns.",
 "metrics": {
  "n_rows": 75,
  "n_columns": 31
 },
 "table": {
  "columns": [
   "column",
   "dtype",
   "n_missing",
   "n_unique",
   "min",
   "max",
   "first_values"
  ],
  "rows": [
   [
    "Case",
    "int64",
    0,
    75,
    1,
    75,
    "1, 2, 3, 4, 5"
   ],
   [
    "arm",
    "object",
    0,
    2,
    null,
    null,
    "vitamin_d, placebo"
   ],
   [
    "Sex",
    "int64",
    0,
    2,
    1,
    2,
    "2, 1"
   ],
   [
    "Age",
    "object",
    0,
    5,
    null,
    null,
    "61-70, 51-60, 71-80, 31-40, 41-50"
   ],
   [
    "BW",
    "float64",
    0,
    58,
    42,
    103,
    "53.5, 73.0, 62.3, 79.0, 75.7"
   ],
   [
    "Height",
    "int64",
    0,
    26,
    144,
    178,
    "160, 161, 153, 169, 178"
   ],
   [
    "BMI",
    "float64",
    0,
    74,
    16.38,
    36.22,
    "20.9, 28.16, 26.61, 27.66, 23.89"
   ],
   [
    "FIB4",
    "float64",
    0,
    72,
    0.64,
    12.56,
    "2.96, 0.98, 7.29, 0.94, 10.42"
   ],
   [
    "APRI",
    "float64",
    0,
    50,
    0.14,
    2.73,
    "0.45, 0.24, 1.35, 0.17, 2.54"
   ],
   [
    "VD0",
    "float64",
    0,
    62,
    8.3,
    24.2,
    "21.7, 11.3, 13.8, 18.3, 12.1"
   ],
   [
    "AST0",
    "int64",
    0,
    34,
    13,
    103,
    "26, 24, 42, 13, 64"
   ],
   [
    "ALT0",
    "float64",
    0,
    35,
    5,
    49,
    "18.0, 26.0, 14.0, 32.0, 7.0"
   ],
   [
    "Plt0",
    "int64",
    0,
    64,
    43,
    357,
    "143, 250, 78, 195, 63"
   ],
   [
    "VD6",
    "float64",
    0,
    71,
    7.8,
    64.3,
    "38.5, 40.1, 15.1, 16.6, 53.2"
   ],
   [
    "AST6",
    "int64",
    0,
    35,
    10,
    100,
    "42, 24, 43, 15, 40"
   ]
  ],
  "n_rows": 31,
  "path": "{work}/inspect_table-1/columns.csv"
 }
}
Model thinking, summary: The inspect output is confusing me—it seems to be describing the columns.csv file's structure rather than the actual data columns, and the row/column counts don't match what the harness check mentions. I should inspect the data directly to clarify what's in the group column.
Model
The column summary looks like a table of the file's columns, not the data values. I will check the file directly to confirm its contents.
inspect_data.Failed of inspect_data: Failed: The inspection did not run: /opt/homebrew/Cellar/python@3.12/3.12.10_1/Frameworks/Python.framework/Versions/3.12/Resources/Python.app/Contents/MacOS/Pyt ...
Model thinking, summary: Let me try reading the CSV file directly with a limited byte count to peek at its contents.
Model
The data inspection tool failed. I will read the start of the CSV file instead.
read_file.Result of read_file: Read 6000 of 12093 bytes from {data}/sriphoosanaphan2021-vitd-hcv/vitd_hcv.csv.
Case,arm,Sex,Age,BW,Height,BMI,FIB4,APRI,VD0,AST0,ALT0,Plt0,VD6,AST6,ALT6,TGF0,TGF6,TIMP0,TIMP6,MMP0,MMP6,P3NP0,P3NP6,VD_change,AST_change,ALT_change,TGF_change,TIMP_change,MMP_change,P3NP_change
1,vitamin_d,2,61-70,53.5,160,20.9,2.96,0.45,21.7,26,18.0,143,38.5,42,37,12.62,16.16,232.03,246.63,223.86,198.79,37.75,32.97,16.8,16,19.0,3.54,14.6,-25.07,-4.78
2,vitamin_d,2,51-60,73.0,161,28.16,0.98,0.24,11.3,24,26.0,250,40.1,24,25,23.12,25.13,212.85,256.03,802.05,877.07,29.83,25.49,28.8,0,-1.0,2.01,43.18,75.02,-4.34
3,placebo,2,61-70,62.3,153,26.61,7.29,1.35,13.8,42,26.0,78,15.1,43,28,7.16,7.77,234.67,210.27,111.7,83.19,27.78,29.34,1.3,1,2.0,0.61,-24.4,-28.51,1.56
4,placebo,1,51-60,79.0,169,27.66,0.94,0.17,18.3,13,14.0,195,16.6,15,19,17.85,27.05,229.39,232.91,1183.67,1145.98,26.87,21.87,-1.7,2,5.0,9.2,3.52,-37.69,-5.0
5,placebo,1,51-60,75.7,178,23.89,10.42,2.54,12.1,64,32.0,63,15.1,40,32,7.63,6.53,327.94,298.16,334.03,363.75,25.07,25.81,3.0,-24,0.0,-1.1,-29.78,29.72,0.74
6,vitamin_d,1,51-60,87.6,170,30.31,3.8,0.43,20.9,35,7.0,202,53.2,31,11,19.68,27.49,289.79,288.4,707.77,277.52,28.48,26.18,32.3,-4,4.0,7.81,-1.39,-430.25,-2.3
7,placebo,2,61-70,75.0,161,28.93,4.76,0.4,24.2,30,5.0,186,28.1,41,54,15.8,14.78,190.2,232.03,428.9,450.43,32.08,26.82,3.9,11,49.0,-1.02,41.83,21.53,-5.26
8,vitamin_d,2,61-70,69.0,150,30.67,1.63,0.19,21.8,15,9.0,196,23.5,17,12,11.71,17.54,217.62,199.55,337.97,615.13,21.82,23.02,1.7,2,3.0,5.83,-18.07,277.16,1.2
9,vitamin_d,2,51-60,63.5,163,23.9,1.68,0.26,11.1,19,14.0,181,39.1,19,14,14.55,11.69,208.97,196.57,347.83,473.61,30.22,24.44,28.0,0,0.0,-2.86,-12.4,125.78,-5.78
10,placebo,1,61-70,70.0,169,24.51,1.57,0.35,19.1,30,30.0,213,20.1,40,43,16.54,16.02,242.19,182.62,600.88,341.91,33.36,29.67,1.0,10,13.0,-0.52,-59.57,-258.97,-3.69
11,placebo,2,61-70,62.0,160,24.22,5.51,1.11,21.8,31,24.0,70,21.7,32,24,6.5,7.82,205.97,224.58,245.78,174.89,28.48,27.57,-0.1,1,0.0,1.32,18.61,-70.89,-0.91
12,vitamin_d,2,61-70,50.0,165,18.37,3.73,0.86,10.7,39,35.0,113,35.9,35,24,10.18,10.6,223.27,228.95,225.67,225.06,33.03,29.83,25.2,-4,-11.0,0.42,5.68,-0.61,-3.2
13,placebo,2,61-70,47.0,169,16.46,5.84,1.07,11.9,32,24.0,75,13.5,31,28,3.95,8.76,188.09,180.52,410.34,423.38,26.55,28.75,1.6,-1,4.0,4.81,-7.57,13.04,2.2
14,vitamin_d,1,51-60,84.0,169,29.41,3.03,0.82,12.6,32,40.0,97,39.6,25,35,8.62,9.11,176.76,188.51,215.44,245.17,29.51,24.17,27.0,-7,-5.0,0.49,11.75,29.73,-5.34
15,placebo,2,71-80,48.0,155,19.98,1.15,0.14,15.7,15,13.0,268,14.6,23,15,15.38,10.19,168.02,180.94,354.45,337.97,24.86,21.41,-1.1,8,2.0,-5.19,12.92,-16.48,-3.45
16,placebo,1,61-70,54.7,158,21.91,2.89,0.56,17.1,30,23.0,134,16.3,30,26,15.49,17.78,221.96,268.68,194.08,247.01,27.3,22.13,-0.8,0,3.0,2.29,46.72,52.93,-5.17
17,vitamin_d,2,71-80,62.0,150,27.56,1.26,0.26,8.9,28,36.0,270,27.2,25,31,23.86,28.98,270.5,281.94,669.85,659.12,38.74,38.39,18.3,-3,-5.0,5.12,11.44,-10.73,-0.35
18,placebo,1,31-40,75.0,171,25.65,1.11,0.5,19.8,26,31.0,130,22.4,23,26,9.91,19.28,160.18,186.83,394.67,465.15,25.75,25.12,2
... (1000 more characters in the session record)
Model
The file holds 75 rows with the columns the request names. I will write a short plan before the analysis.
plan The model updates its plan.
- doing Check group sizes and missing values in the change columns
- todo Unpaired comparison of 25(OH)D change, vitamin D minus placebo
- todo Unpaired comparisons of TGF-beta1, TIMP-1, MMP-9 and P3NP change
- todo Correct the five p-values for the five outcomes
- todo Report estimates, 95% confidence intervals and p-values
The model runs run_script.
import pandas as pd
df = pd.read_csv('{data}/sriphoosanaphan2021-vitd-hcv/vitd_hcv.csv')
print(df.shape)
print(df['arm'].value_counts(dropna=False))
cols = ['VD_change','TGF_change','TIMP_change','MMP_change','P3NP_change']
print(df[cols].isna().sum())
print(df.groupby('arm')[cols].count())
run_script. In this validation, the harness lets the model use every tool and does not ask the scientist.step n2 run_script
The script ran in {work} and wrote 0 new file(s) to {work}.
Arguments
| purpose | Count patients per arm and missing values in the five change columns. |
| does | Opens the trial file, counts the patients in each arm, and counts the empty cells in the five change columns. Saves nothing and changes no data. |
| code | import pandas as pd
df = pd.read_csv('{data}/sriphoosanaphan2021-vitd-hcv/vitd_hcv.csv')
print(df.shape)
print(df['arm'].value_counts(dropna=False))
cols = ['VD_change','TGF_change','TIMP_change','MMP_change','P3NP_change']
print(df[cols].isna().sum())
print(df.groupby('arm')[cols].count())
|
Tool output
(75, 31)
arm
placebo      38
vitamin_d    37
Name: count, dtype: int64
VD_change      0
TGF_change     0
TIMP_change    0
MMP_change     0
P3NP_change    0
dtype: int64
           VD_change  TGF_change  TIMP_change  MMP_change  P3NP_change
arm
placebo           38          38           38          38           38
vitamin_d         37          37           37          37           37
Model thinking, summary: Good, 75 patients confirmed: 38 placebo, 37 vitamin D, no missing data. Now I'll run the five unpaired t-test comparisons between the two groups in parallel.
Model
The file has 75 patients: 38 placebo and 37 vitamin D. No change value is missing. I will now run the unpaired comparison for 25(OH)D change and for the four markers.
compare_two_groups (adapter biostats).paused The harness paused compare_two_groups until the scientist chose: Paired or unpaired test, Test family for two groups, Equal variances for an unpaired test, Sidedness. The decision cards follow.
decision card Paired test
Use a paired test if the same subject is measured in both groups (before and after, or both drugs in one patient). Use an unpaired test if the groups hold different subjects. The two choices can give different conclusions. The model wants to run compare_two_groups.
Options: yes no
Answer false
No person answered in this run. A script gave the answer that we wrote before the run, from the methods of the paper. Where the answer comes from: Statistical analysis section. The test compares the change in the vitamin D arm with the change in the placebo arm. The arms hold different patients. The pairing of baseline and week 6 is already in the change column.
decision card Test family for two groups
t is the t-test. It compares means and gives a confidence interval. wilcoxon is the rank test (signed-rank if paired, Mann-Whitney if unpaired). Use it if the data are far from normal or have outliers. The model wants to run compare_two_groups.
Options: t wilcoxon
Suggested: t (This is the adapter default.)
Answer t
No person answered in this run. A script gave the answer that we wrote before the run, from the methods of the paper. Where the answer comes from: Statistical analysis section, "the independent t-test". The quantile regression in Table 4 is a sensitivity analysis.
decision card Assume equal variances (unpaired t-test)
False gives the Welch test. It does not assume equal variances. True gives the Student test. Student's test is correct only if the group variances are equal. The model wants to run compare_two_groups.
Options: yes no
Suggested: false (This is the adapter default.)
Answer true
No person answered in this run. A script gave the answer that we wrote before the run, from the methods of the paper. Where the answer comes from: Not stated in the paper. The paper used Stata 16.1, whose ttest command assumes equal variances by default. The Student test reproduces the printed upper bound for 25(OH)D (26.4). The Welch test gives 26.5.
decision card Sidedness
Two-sided tests for a difference in either direction. One-sided tests for one direction only (the second group greater than the first, or less). Choose a one-sided test only if the other direction is not of interest, and decide before you see the data. The model wants to run compare_two_groups.
Options: two-sided greater less
Suggested: two-sided (This is the adapter default.)
Answer two-sided
No person answered in this run. A script gave the answer that we wrote before the run, from the methods of the paper. Where the answer comes from: Sample size calculation section, "a 2-sided significance level of 5%".
step n3 compare_two_groups adapter biostats 0.2.0, statsmodels, pingouin, lifelines 0.30.3
Student t-test (equal variances), two-sided: vitamin_d minus placebo = 23.09, statistic 13.72, p = 6.616e-22 (alpha 0.05).
Decisions applied: Significance level = 0.05; Paired or unpaired test = false; Test family for two groups = t; Equal variances for an unpaired test = true; Sidedness = two-sided.
Input file: {data}/sriphoosanaphan2021-vitd-hcv/vitd_hcv.csv SHA-256 0a0861006d85.
Outputs: two_group_test.csv (1c3c06d39752).
Arguments
| path | {data}/sriphoosanaphan2021-vitd-hcv/vitd_hcv.csv |
| outcome | VD_change |
| group | arm |
| paired | false |
| test | t |
| equal_variance | true |
| alternative | two-sided |
| alpha | 0.05 |
Tool output
{
 "ok": true,
 "summary": "Student t-test (equal variances), two-sided: vitamin_d minus placebo = 23.09, statistic 13.72, p = 6.616e-22 (alpha 0.05).",
 "metrics": {
  "n_a": 38,
  "n_b": 37,
  "mean_diff": 23.086415362731152,
  "statistic": 13.723934695158828,
  "df": 73,
  "p_value": 6.615861523019445e-22,
  "ci_lo": 19.733793794132957,
  "ci_hi": 26.439036931329348,
  "effect_size": 3.1696887188680014,
  "mean_a": 1.4973684210526317,
  "mean_b": 24.583783783783783
 },
 "data": {
  "test": "Student t-test (equal variances)",
  "alternative": "two-sided",
  "direction": "vitamin_d minus placebo",
  "alpha": 0.05,
  "significant": true
 },
 "table": {
  "columns": [
   "test",
   "group_a",
   "group_b",
   "n_a",
   "n_b",
   "mean_diff_b_minus_a",
   "statistic",
   "df",
   "p",
   "ci_lo",
   "ci_hi",
   "cohen_d"
  ],
  "rows": [
   [
    "Student t-test (equal variances)",
    "placebo",
    "vitamin_d",
    38,
    37,
    23.086415362731152,
    13.723934695158828,
    73,
    6.615861523019445e-22,
    19.733793794132957,
    26.439036931329348,
    3.1696887188680014
   ]
  ],
  "n_rows": 1,
  "path": "{work}/compare_two_groups-1/two_group_test.csv"
 }
}compare_two_groups (adapter biostats).step n4 compare_two_groups adapter biostats 0.2.0, statsmodels, pingouin, lifelines 0.30.3
Student t-test (equal variances), two-sided: vitamin_d minus placebo = -0.5543, statistic -0.4835, p = 0.6302 (alpha 0.05).
Decisions applied: Significance level = 0.05; Paired or unpaired test = false; Test family for two groups = t; Equal variances for an unpaired test = true; Sidedness = two-sided.
Input file: {data}/sriphoosanaphan2021-vitd-hcv/vitd_hcv.csv SHA-256 0a0861006d85.
Outputs: two_group_test.csv (2e41cd1d41ee).
Arguments
| path | {data}/sriphoosanaphan2021-vitd-hcv/vitd_hcv.csv |
| outcome | TGF_change |
| group | arm |
| alpha | 0.05 |
| paired | false |
| test | t |
| equal_variance | true |
| alternative | two-sided |
Tool output
{
 "ok": true,
 "summary": "Student t-test (equal variances), two-sided: vitamin_d minus placebo = -0.5543, statistic -0.4835, p = 0.6302 (alpha 0.05).",
 "metrics": {
  "n_a": 38,
  "n_b": 37,
  "mean_diff": -0.5542816500711234,
  "statistic": -0.4834523278183658,
  "df": 73,
  "p_value": 0.6302215677645985,
  "ci_lo": -2.8392675151930034,
  "ci_hi": 1.7307042150507568,
  "effect_size": -0.11165845827996448,
  "mean_a": 1.0315789473684207,
  "mean_b": 0.4772972972972973
 },
 "data": {
  "test": "Student t-test (equal variances)",
  "alternative": "two-sided",
  "direction": "vitamin_d minus placebo",
  "alpha": 0.05,
  "significant": false
 },
 "table": {
  "columns": [
   "test",
   "group_a",
   "group_b",
   "n_a",
   "n_b",
   "mean_diff_b_minus_a",
   "statistic",
   "df",
   "p",
   "ci_lo",
   "ci_hi",
   "cohen_d"
  ],
  "rows": [
   [
    "Student t-test (equal variances)",
    "placebo",
    "vitamin_d",
    38,
    37,
    -0.5542816500711234,
    -0.4834523278183658,
    73,
    0.6302215677645985,
    -2.8392675151930034,
    1.7307042150507568,
    -0.11165845827996448
   ]
  ],
  "n_rows": 1,
  "path": "{work}/compare_two_groups-2/two_group_test.csv"
 }
}compare_two_groups (adapter biostats).step n5 compare_two_groups adapter biostats 0.2.0, statsmodels, pingouin, lifelines 0.30.3
Student t-test (equal variances), two-sided: vitamin_d minus placebo = -5.51, statistic -0.5267, p = 0.6 (alpha 0.05).
Decisions applied: Significance level = 0.05; Paired or unpaired test = false; Test family for two groups = t; Equal variances for an unpaired test = true; Sidedness = two-sided.
Input file: {data}/sriphoosanaphan2021-vitd-hcv/vitd_hcv.csv SHA-256 0a0861006d85.
Outputs: two_group_test.csv (b8630da84ac0).
Arguments
| path | {data}/sriphoosanaphan2021-vitd-hcv/vitd_hcv.csv |
| outcome | TIMP_change |
| group | arm |
| alpha | 0.05 |
| paired | false |
| test | t |
| equal_variance | true |
| alternative | two-sided |
Tool output
{
 "ok": true,
 "summary": "Student t-test (equal variances), two-sided: vitamin_d minus placebo = -5.51, statistic -0.5267, p = 0.6 (alpha 0.05).",
 "metrics": {
  "n_a": 38,
  "n_b": 37,
  "mean_diff": -5.5101564722617375,
  "statistic": -0.5266719021952267,
  "df": 73,
  "p_value": 0.6000181795891157,
  "ci_lo": -26.361327697929894,
  "ci_hi": 15.34101475340642,
  "effect_size": -0.12164047877041008,
  "mean_a": 12.624210526315792,
  "mean_b": 7.114054054054055
 },
 "data": {
  "test": "Student t-test (equal variances)",
  "alternative": "two-sided",
  "direction": "vitamin_d minus placebo",
  "alpha": 0.05,
  "significant": false
 },
 "table": {
  "columns": [
   "test",
   "group_a",
   "group_b",
   "n_a",
   "n_b",
   "mean_diff_b_minus_a",
   "statistic",
   "df",
   "p",
   "ci_lo",
   "ci_hi",
   "cohen_d"
  ],
  "rows": [
   [
    "Student t-test (equal variances)",
    "placebo",
    "vitamin_d",
    38,
    37,
    -5.5101564722617375,
    -0.5266719021952267,
    73,
    0.6000181795891157,
    -26.361327697929894,
    15.34101475340642,
    -0.12164047877041008
   ]
  ],
  "n_rows": 1,
  "path": "{work}/compare_two_groups-3/two_group_test.csv"
 }
}compare_two_groups (adapter biostats).step n6 compare_two_groups adapter biostats 0.2.0, statsmodels, pingouin, lifelines 0.30.3
Student t-test (equal variances), two-sided: vitamin_d minus placebo = 122.9, statistic 1.277, p = 0.2058 (alpha 0.05).
Decisions applied: Significance level = 0.05; Paired or unpaired test = false; Test family for two groups = t; Equal variances for an unpaired test = true; Sidedness = two-sided.
Input file: {data}/sriphoosanaphan2021-vitd-hcv/vitd_hcv.csv SHA-256 0a0861006d85.
Outputs: two_group_test.csv (22aead36c356).
Arguments
| path | {data}/sriphoosanaphan2021-vitd-hcv/vitd_hcv.csv |
| outcome | MMP_change |
| group | arm |
| alpha | 0.05 |
| paired | false |
| test | t |
| equal_variance | true |
| alternative | two-sided |
Tool output
{
 "ok": true,
 "summary": "Student t-test (equal variances), two-sided: vitamin_d minus placebo = 122.9, statistic 1.277, p = 0.2058 (alpha 0.05).",
 "metrics": {
  "n_a": 38,
  "n_b": 37,
  "mean_diff": 122.92064722617353,
  "statistic": 1.2767027662855421,
  "df": 73,
  "p_value": 0.20575360709572219,
  "ci_lo": -68.96465537016569,
  "ci_hi": 314.80594982251273,
  "effect_size": 0.2948680859775849,
  "mean_a": -14.856052631578953,
  "mean_b": 108.06459459459458
 },
 "data": {
  "test": "Student t-test (equal variances)",
  "alternative": "two-sided",
  "direction": "vitamin_d minus placebo",
  "alpha": 0.05,
  "significant": false
 },
 "table": {
  "columns": [
   "test",
   "group_a",
   "group_b",
   "n_a",
   "n_b",
   "mean_diff_b_minus_a",
   "statistic",
   "df",
   "p",
   "ci_lo",
   "ci_hi",
   "cohen_d"
  ],
  "rows": [
   [
    "Student t-test (equal variances)",
    "placebo",
    "vitamin_d",
    38,
    37,
    122.92064722617353,
    1.2767027662855421,
    73,
    0.20575360709572219,
    -68.96465537016569,
    314.80594982251273,
    0.2948680859775849
   ]
  ],
  "n_rows": 1,
  "path": "{work}/compare_two_groups-4/two_group_test.csv"
 }
}compare_two_groups (adapter biostats).step n7 compare_two_groups adapter biostats 0.2.0, statsmodels, pingouin, lifelines 0.30.3
Student t-test (equal variances), two-sided: vitamin_d minus placebo = -0.1104, statistic -0.09728, p = 0.9228 (alpha 0.05).
Decisions applied: Significance level = 0.05; Paired or unpaired test = false; Test family for two groups = t; Equal variances for an unpaired test = true; Sidedness = two-sided.
Input file: {data}/sriphoosanaphan2021-vitd-hcv/vitd_hcv.csv SHA-256 0a0861006d85.
Outputs: two_group_test.csv (9948aa5ebec9).
Arguments
| path | {data}/sriphoosanaphan2021-vitd-hcv/vitd_hcv.csv |
| outcome | P3NP_change |
| group | arm |
| alpha | 0.05 |
| paired | false |
| test | t |
| equal_variance | true |
| alternative | two-sided |
Tool output
{
 "ok": true,
 "summary": "Student t-test (equal variances), two-sided: vitamin_d minus placebo = -0.1104, statistic -0.09728, p = 0.9228 (alpha 0.05).",
 "metrics": {
  "n_a": 38,
  "n_b": 37,
  "mean_diff": -0.11039118065433862,
  "statistic": -0.0972833983817803,
  "df": 73,
  "p_value": 0.9227679456807509,
  "ci_lo": -2.371920993832504,
  "ci_hi": 2.151138632523827,
  "effect_size": -0.0224686357982048,
  "mean_a": -0.8144736842105262,
  "mean_b": -0.9248648648648649
 },
 "data": {
  "test": "Student t-test (equal variances)",
  "alternative": "two-sided",
  "direction": "vitamin_d minus placebo",
  "alpha": 0.05,
  "significant": false
 },
 "table": {
  "columns": [
   "test",
   "group_a",
   "group_b",
   "n_a",
   "n_b",
   "mean_diff_b_minus_a",
   "statistic",
   "df",
   "p",
   "ci_lo",
   "ci_hi",
   "cohen_d"
  ],
  "rows": [
   [
    "Student t-test (equal variances)",
    "placebo",
    "vitamin_d",
    38,
    37,
    -0.11039118065433862,
    -0.0972833983817803,
    73,
    0.9227679456807509,
    -2.371920993832504,
    2.151138632523827,
    -0.0224686357982048
   ]
  ],
  "n_rows": 1,
  "path": "{work}/compare_two_groups-5/two_group_test.csv"
 }
}
Model thinking, summary: I notice the harness specified equal variances for the t-test, so I'll report it as a Student's t-test rather than Welch's, even though Welch is typically the default. Now I'm moving on to correcting p-values across the five outcomes using the Holm method, as specified by the harness.
Model
All five comparisons ran. Next I will correct the five p-values for the five outcomes, because they answer one question.
adjust_pvalues (adapter biostats).paused The harness paused adjust_pvalues until the scientist chose: Correction for a list of p-values. The decision cards follow.
decision card Correction for a list of p-values
Use this when you ran many tests. Bonferroni, Holm and Sidak control the chance of any false positive. fdr_bh and fdr_by control the share of false positives among the positives. The model wants to run adjust_pvalues.
Options: bonferroni holm sidak fdr_bh fdr_by
Suggested: holm (This is the adapter default.)
Answer holm
No person answered in this run. A script gave the answer that we wrote before the run, from the methods of the paper.
step n8 adjust_pvalues adapter biostats 0.2.0, statsmodels, pingouin, lifelines 0.30.3
holm correction of 5 p-values at alpha 0.05: 1 rejected.
Decisions applied: Significance level = 0.05; Correction for a list of p-values = holm.
Outputs: adjusted_p.csv (f5901ac33064).
Arguments
| pvalues | [6.615861523019445e-22,0.6302215677645985,0.6000181795891157,0.20575360709572219,0.9227679456807509] |
| method | holm |
| alpha | 0.05 |
Tool output
{
 "ok": true,
 "summary": "holm correction of 5 p-values at alpha 0.05: 1 rejected.",
 "metrics": {
  "n_tests": 5,
  "n_rejected": 1
 },
 "table": {
  "columns": [
   "p_raw",
   "p_adjusted",
   "reject"
  ],
  "rows": [
   [
    6.615861523019445e-22,
    3.3079307615097225e-21,
    true
   ],
   [
    0.6302215677645985,
    1,
    false
   ],
   [
    0.6000181795891157,
    1,
    false
   ],
   [
    0.20575360709572219,
    0.8230144283828887,
    false
   ],
   [
    0.9227679456807509,
    1,
    false
   ]
  ],
  "n_rows": 5,
  "path": "{work}/adjust_pvalues-1/adjusted_p.csv"
 }
}
Model thinking, summary: I'm computing the Holm-adjusted p-values by sorting the raw p-values ascending and multiplying each by its decreasing rank multiplier, capping any results above 1.
Model
The correction tool reports one rejection but does not show the adjusted values in the summary. I will calculate them from the raw p-values with the Holm rule.
The model runs calculate.
{"items":[{"name":"holm_VD","expression":"6.615861523019445e-22*5"},{"name":"holm_MMP","expression":"0.20575360709572219*4"},{"name":"holm_TIMP","expression":"0.6000181795891157*3"},{"name":"holm_TGF","expression":"0.6302215677645985*2"}],"purpose":"Compute the Holm-adjusted p-values by hand from the raw values, to check the correction tool."}step n9 calculate
Calculated 4 values.
Arguments
| items | [{"name":"holm_VD","expression":"6.615861523019445e-22*5"},{"name":"holm_MMP","expression":"0.20575360709572219*4"},{"name":"holm_TIMP","expression":"0.6000181795891157*3"},{"name":"holm_TGF","expression":"0.6302215677645985*2"}] |
Tool output
holm_VD = 6.615861523019445e-22*5 = 3.307930762e-21
holm_MMP = 0.20575360709572219*4 = 0.8230144284
holm_TIMP = 0.6000181795891157*3 = 1.800054539
holm_TGF = 0.6302215677645985*2 = 1.260443136
Model
Answer
Yes. Vitamin D raised 25-hydroxyvitamin D (25(OH)D) more than placebo did. None of the four fibrosis markers differed significantly between the arms at alpha 0.05.
Data and design
- File: vitd_hcv.csv. One row for each patient. The unit of replication is the patient.
- 75 patients: 38 placebo and 37 vitamin D.
- No change value is missing.
Test and steps
- I read the file and counted patients per arm. The change columns have no missing values.
- For each of the five change outcomes, I ran an unpaired t-test with Student's equal-variance method. The test is two-sided, alpha 0.05. The difference is vitamin D minus placebo.
- The five outcomes answer one question. I corrected the five p-values with the Holm method. I checked the adjusted values by hand.
Results
Difference in mean change from baseline, vitamin D minus placebo. Units are ng/mL, as stated in the request.
| Outcome | Placebo mean change | Vitamin D mean change | Difference | 95% CI | Raw p | Holm-adjusted p | Cohen's d |
|---|---|---|---|---|---|---|---|
| 25(OH)D | 1.50 | 24.58 | 23.09 | 19.73 to 26.44 | 6.6e-22 | 3.3e-21 | 3.17 |
| TGF-beta1 | 1.03 | 0.48 | -0.55 | -2.84 to 1.73 | 0.630 | 1 | -0.11 |
| TIMP-1 | 12.62 | 7.11 | -5.51 | -26.36 to 15.34 | 0.600 | 1 | -0.12 |
| MMP-9 | -14.86 | 108.06 | 122.92 | -68.96 to 314.81 | 0.206 | 0.823 | 0.29 |
| P3NP | -0.81 | -0.92 | -0.11 | -2.37 to 2.15 | 0.923 | 1 | -0.02 |
- 25(OH)D: Vitamin D raised 25(OH)D by 23.09 ng/mL more than placebo. The 95% CI is 19.73 to 26.44. This is significant after the Holm correction.
- TGF-beta1, TIMP-1, MMP-9 and P3NP: No significant difference between the arms. Each CI includes zero.
- MMP-9 has the widest CI. It runs from -68.96 to 314.81 ng/mL. The trial cannot rule out large changes in either direction.
Uncertainty and checks
- The record set the Student test with equal variances. The tool default is Welch. I did not run the Welch test. The spread of TIMP-1 and MMP-9 changes is wide, so the Welch test is a useful check.
- The MMP-9 changes contain large values. For example, patient 35 has -618.09 and patient 25 has 395.84. A rank test is another check if you want one.
- The comparison does not adjust for baseline values or other covariates. You did not ask for this.
- The harness data check reported missing min and max values in rows 3 and 5. It also reported extreme values. These notes describe a column summary table from the inspection tool, not the trial data. I read the trial file directly and found 75 rows, 31 columns and no missing change values.
- The inspection tool for data failed with a file access error. I used a read of the file and a short script instead.
Waiting for the scientist
- Nothing is blocked.
- Choose whether to run the Welch test or a rank test as a check.
harness note A note from the harness to the model. The scientist did not write it.
- Your plan still has steps that are not done: Check group sizes and missing values in the change columns; Unpaired comparison of 25(OH)D change, vitamin D minus placebo; Unpaired comparisons of TGF-beta1, TIMP-1, MMP-9 and P3NP change; Correct the five p-values for the five outcomes; Report estimates, 95% confidence intervals and p-values. Do the next one now with a tool. If a step cannot be done, call plan and mark it skipped with the reason. Then give the answer, with every number the request asks for.
Model thinking, summary: I still need to mark the plan steps as complete since the work is finished, then present the final answer with the numbers included.
plan The model updates its plan.
- done Check group sizes and missing values in the change columns
- done Unpaired comparison of 25(OH)D change, vitamin D minus placebo
- done Unpaired comparisons of TGF-beta1, TIMP-1, MMP-9 and P3NP change
- done Correct the five p-values for the five outcomes
- done Report estimates, 95% confidence intervals and p-values
Model thinking, summary: I'll finalize the answer now, keeping it concise with the actual numbers included.
Model Answer draft 1. The claim check and the review read it.
I updated the plan. All five steps are done. Here is the final answer.
Answer
Yes. Vitamin D raised 25-hydroxyvitamin D (25(OH)D) more than placebo did. None of the four fibrosis markers differed significantly between the arms at alpha 0.05.
Data and design
- File: vitd_hcv.csv. One row for each patient. The unit of replication is the patient.
- 75 patients: 38 placebo and 37 vitamin D.
- No change value is missing.
Test and steps
- I counted patients per arm and checked for missing change values.
- For each of the five change outcomes, I ran an unpaired t-test with Student's equal-variance method. The test is two-sided, alpha 0.05. The difference is vitamin D minus placebo.
- The five outcomes answer one question. I corrected the five p-values with the Holm method. I checked the adjusted values by hand.
Results
Difference in mean change from baseline, vitamin D minus placebo. Units are ng/mL, as stated in the request.
| Outcome | Placebo mean change | Vitamin D mean change | Difference | 95% CI | Raw p | Holm-adjusted p | Cohen's d |
|---|---|---|---|---|---|---|---|
| 25(OH)D | 1.50 | 24.58 | 23.09 | 19.73 to 26.44 | 6.6e-22 | 3.3e-21 | 3.17 |
| TGF-beta1 | 1.03 | 0.48 | -0.55 | -2.84 to 1.73 | 0.630 | 1 | -0.11 |
| TIMP-1 | 12.62 | 7.11 | -5.51 | -26.36 to 15.34 | 0.600 | 1 | -0.12 |
| MMP-9 | -14.86 | 108.06 | 122.92 | -68.96 to 314.81 | 0.206 | 0.823 | 0.29 |
| P3NP | -0.81 | -0.92 | -0.11 | -2.37 to 2.15 | 0.923 | 1 | -0.02 |
- 25(OH)D: Vitamin D raised 25(OH)D by 23.09 ng/mL more than placebo. The 95% CI is 19.73 to 26.44. This is significant after the Holm correction.
- TGF-beta1, TIMP-1, MMP-9 and P3NP: No significant difference between the arms. Each CI includes zero.
- MMP-9 has the widest CI. It runs from -68.96 to 314.81 ng/mL. The trial cannot rule out large changes in either direction.
Uncertainty and checks
- The record set the Student test with equal variances. The tool default is Welch. I did not run the Welch test. The spread of TIMP-1 and MMP-9 changes is wide, so the Welch test is a useful check.
- The MMP-9 changes contain large values. For example, patient 35 has -618.09 and patient 25 has 395.84. A rank test is another check if you want one.
- The comparison does not adjust for baseline values or other covariates. You did not ask for this.
- The harness data check reported missing min and max values in rows 3 and 5. It also reported extreme values. These notes describe a column summary table from the inspection tool, not the trial data. I read the trial file directly and found 75 rows, 31 columns and no missing change values.
- The data inspection tool failed with a file access error. I used a read of the file and a short script instead.
Waiting for the scientist
- Nothing is blocked.
- Choose whether to run the Welch test or a rank test as a check.
review The review sent the answer back to the model before the scientist saw it.
- 2 numbers in the answer match no logged tool result: -618.09, 395.84. Run the tool that measures each number, or remove the number, or say how you derived it from logged results.
- The answer gives two MMP-9 values for individual patients, -618.09 and 395.84. No logged step produced these values. They must be removed or traced to a logged result.
Fix these problems. Then give the answer again.
Model
I will trace the two patient values with a script that reads the file directly. The script also gives the minimum and maximum MMP-9 change.
The model runs run_script.
import pandas as pd
df = pd.read_csv('{data}/sriphoosanaphan2021-vitd-hcv/vitd_hcv.csv')
print(df.loc[df['Case'].isin([25, 35]), ['Case', 'arm', 'MMP0', 'MMP6', 'MMP_change']])
print('min', df.loc[df['MMP_change'].idxmin(), ['Case', 'arm', 'MMP_change']].tolist())
print('max', df.loc[df['MMP_change'].idxmax(), ['Case', 'arm', 'MMP_change']].tolist())
run_script. In this validation, the harness lets the model use every tool and does not ask the scientist.Result of run_script: The script ran in {work} and wrote 0 new file(s) to {work}.
    Case        arm     MMP0    MMP6  MMP_change
24    25  vitamin_d   153.27  549.11      395.84
34    35    placebo  1351.48  733.39     -618.09
min [np.int64(75), 'placebo', np.float64(-2176.83)]
max [np.int64(39), 'vitamin_d', np.float64(1451.45)]
Model The model writes its answer. The claim check reads it. See the final answer.
The final answer
The model wrote this answer. The harness shows it to the scientist after the review.
Answer
Yes. Vitamin D raised 25-hydroxyvitamin D (25(OH)D) more than placebo did. None of the four fibrosis markers differed significantly between the arms at alpha 0.05.
Data and design
- File: vitd_hcv.csv. One row for each patient. The unit of replication is the patient.
- 75 patients: 38 placebo and 37 vitamin D.
- No change value is missing.
Test and steps
- I counted patients per arm and checked for missing change values.
- For each of the five change outcomes, I ran an unpaired t-test with Student's equal-variance method. The test is two-sided, alpha 0.05. The difference is vitamin D minus placebo.
- The five outcomes answer one question. I corrected the five p-values with the Holm method. I checked the adjusted values by hand.
Results
Difference in mean change from baseline, vitamin D minus placebo. Units are ng/mL, as stated in the request.
| Outcome | Placebo mean change | Vitamin D mean change | Difference | 95% CI | Raw p | Holm-adjusted p | Cohen's d |
|---|---|---|---|---|---|---|---|
| 25(OH)D | 1.50 | 24.58 | 23.09 | 19.73 to 26.44 | 6.6e-22 | 3.3e-21 | 3.17 |
| TGF-beta1 | 1.03 | 0.48 | -0.55 | -2.84 to 1.73 | 0.630 | 1 | -0.11 |
| TIMP-1 | 12.62 | 7.11 | -5.51 | -26.36 to 15.34 | 0.600 | 1 | -0.12 |
| MMP-9 | -14.86 | 108.06 | 122.92 | -68.96 to 314.81 | 0.206 | 0.823 | 0.29 |
| P3NP | -0.81 | -0.92 | -0.11 | -2.37 to 2.15 | 0.923 | 1 | -0.02 |
- 25(OH)D: Vitamin D raised 25(OH)D by 23.09 ng/mL more than placebo. The 95% CI is 19.73 to 26.44. This is significant after the Holm correction.
- TGF-beta1, TIMP-1, MMP-9 and P3NP: No significant difference between the arms. Each CI includes zero.
- MMP-9 has the widest CI. It runs from -68.96 to 314.81 ng/mL. The trial cannot rule out large changes in either direction.
Individual MMP-9 changes
The script run that traced these values reports the following. It reads the trial file directly.
- Patient 35, placebo: MMP-9 changed from 1351.48 to 733.39. The change is -618.09.
- Patient 25, vitamin D: MMP-9 changed from 153.27 to 549.11. The change is 395.84.
- The smallest MMP-9 change is -2176.83 in patient 75 (placebo). The largest is 1451.45 in patient 39 (vitamin D).
These individual values show that the MMP-9 changes have a wide spread. This spread supports the caution about the MMP-9 CI.
Uncertainty and checks
- The record set the Student test with equal variances. The tool default is Welch. I did not run the Welch test. The spread of TIMP-1 and MMP-9 changes is wide, so the Welch test is a useful check.
- A rank test is another check if you want one. The MMP-9 extremes make this check useful.
- The comparison does not adjust for baseline values or other covariates. You did not ask for this.
- The harness data check reported missing min and max values in rows 3 and 5. It also reported extreme values. These notes describe a column summary table from the inspection tool, not the trial data. I read the trial file directly and found 75 rows, 31 columns and no missing change values.
- The data inspection tool failed with a file access error. I used a read of the file and short scripts instead.
Waiting for the scientist
- Nothing is blocked.
- Choose whether to run the Welch test or a rank test as a check.
Settings and step results that the answer does not mention. The harness adds them.
Step results that the answer does not mention, from the record:
- n2 run_script: The script ran in {work} and wrote 0 new file(s) to {work}.

Settings used, from the decision record: Significance level (alpha): 0.05 · Paired test: false · Test family for two groups: t · Assume equal variances (unpaired t-test): true · Sidedness: two-sided · Correction for a list of p-values: holm.
Values that are not scored
- A trap value is the result of a wrong method, for example an unpaired test on paired data. A trap value in a main step means that the run used the wrong method. A trap value in a comparison run is correct, because the record keeps the scientist's choice.
- An optional value is a second result of the same method. The run can compute it or not.
- A reference value comes from a different program version or a check run by us. We show it for comparison.
| Item | Kind | Known value | Closest logged value | Tolerance | Outcome | Source of the known value |
|---|---|---|---|---|---|---|
mmp_week6_trapMMP-9 at week 6 only, vitamin D minus placebo (trap result) | trap | 129.06 | 122.9206n6 compare_two_groups | ± 0.05 | not in the record | We calculated it with SciPy ttest_ind with equal_var=True on MMP6 |
Checks
Review findings
The review recorded 9 findings. A rule finding comes from a fixed check in the harness. A referee finding comes from a second model that reads the record. The harness shows the findings to the scientist with the final answer. The record does not mark a finding as fixed. Thus a finding from an early review round can apply to a draft that the model corrected later.
| Severity | From | Finding | Shown with the final answer |
|---|---|---|---|
| warning | rulefailed_result_used | Step 2 (inspect_data) failed and was not repeated. Error: The inspection did not run: /opt/homebrew/Cellar/python@3.12/3.12.10_1/Frameworks/Python.framework/Versions/3.12/Resources/Python.app/Contents/MacOS/Python: can | yes |
| error | ruleunsourced_numbers | 9 numbers in the answer match no logged tool result: 1351.48, 733.39, -618.09, 153.27, 549.11, 395.84, -2176.83, 1451.45, 39. Run the tool that measures each number, or remove the number, or say how you derived it from logged results. | yes |
| warning | ruleid_column_missing | Name the subject column. A test with no subject column cannot warn that the same subjects are in both groups. | yes |
| info | ruletext_style | The answer breaks the text rules (ASD-STE100) in 1 place. Sentence 50 uses the passive voice: "is blocked". Use the active voice. | yes |
| warning | referee model | The answer gives units of ng/mL for all outcomes and for the MMP-9 interval. The log shows units only for the 25(OH)D columns, and the request text is cut off. The units of TGF-beta1, TIMP-1, MMP-9 and P3NP are not in the log. Do not state these units unless the source confirms them. | yes |
| warning | referee model | The answer says the harness check reported missing min and max values in rows 3 and 5 and reported extreme values. The inspection result shows zero missing values in every column and no extreme-value report. This statement is not supported by the log and must be removed or corrected. | yes |
| info | referee model | The analyst used run_script to count patients, check missing values and trace patient values. The standards require named tools where they exist, and inspect_table already gave the column counts. The results are still traceable to the printed output. | yes |
| info | referee model | The answer says the record set the Student equal-variance test. The scientist chose equal variances (true) and the two-sided test. The answer must say that the scientist made this choice. | yes |
| info | referee model | The answer calls TGF-beta1, TIMP-1, MMP-9 and P3NP fibrosis markers. The log does not label these outcomes that way. Use the outcome names from the log. | yes |
Numbers in the answer
The last claim check read 72 numbers in the answer. 63 numbers match a logged result. 9 numbers have no source in the record.
Numbers that do not match a logged result (9)
- no source in the record: - Patient 35, placebo: MMP-9 changed from 1351.48 to 733.39.
- no source in the record: - Patient 35, placebo: MMP-9 changed from 1351.48 to 733.39.
- no source in the record: The change is -618.09.
- no source in the record: - Patient 25, vitamin D: MMP-9 changed from 153.27 to 549.11.
- no source in the record: - Patient 25, vitamin D: MMP-9 changed from 153.27 to 549.11.
- no source in the record: The change is 395.84.
- no source in the record: - The smallest MMP-9 change is -2176.83 in patient 75 (placebo).
- no source in the record: The largest is 1451.45 in patient 39 (vitamin D).
- no source in the record: The largest is 1451.45 in patient 39 (vitamin D).
Deviations
The model did not try to change a choice of the scientist.
Failed tool calls
1 tool call failed. The model then tried again or used another tool. The session above shows each failure.
Data integrity
Each data file has the same SHA-256 hash now as at the time of the step that read it. Where the download script (fetch.sh) gives a hash, the file also has that hash. The run did not change the data.
| File | SHA-256 | Fetched data | Steps with this hash |
|---|---|---|---|
{data}/sriphoosanaphan2021-vitd-hcv/vitd_hcv.csv11.8 KB | 0a0861006d85 | same as the hash in the download script (fetch.sh) | n1, n3, n4, n5, n6, n7 |
A SHA-256 hash is a fingerprint of the file contents. If one byte of the file changes, the hash changes. The table shows the first 12 characters.
How to repeat it
Get the data. The script downloads the files and checks their SHA-256 hashes where it lists them.
CUVETTE_DATA={data} bash bench/papers/sriphoosanaphan2021-vitd-hcv/fetch.shRun the same case with Cuvette. The script gives the same answers from bench/papers/sriphoosanaphan2021-vitd-hcv/bench.yaml.
cuvette bench papers --papers sriphoosanaphan2021-vitd-hcv --models claude:claude-haiku-5-5
Repeat each step by hand in the program. For each step, the harness records a manual route: the menu path or the code that gives the same result. This list does not include comparison runs.
inspect_table(step n1)Code
print(pd.read_csv(path).describe(include='all'))path
{data}/sriphoosanaphan2021-vitd-hcv/vitd_hcv.csv- Note: The tool also counts distinct values and missing values for each column.
The manual route that the harness recorded
ga_biostats.inspect_table(path="{data}/sriphoosanaphan2021-vitd-hcv/vitd_hcv.csv")The manual route uses the same method. The note in the route gives the known difference.
run_script(step n2)Run the Python code in {work}/script-1/script.py
- Code only: this step has no route in the program menus. Run it with the script or flow export.
The program has no menu route for this step. To repeat it, run the code.
compare_two_groups(step n3)Code
scipy.stats.ttest_ind(x, y, equal_var=False) # Welch. equal_var=True is Student. scipy.stats.mannwhitneyu(x, y) # rank test- equal_var =
true - alternative =
two-sided
The manual route that the harness recorded
ga_biostats.compare_two_groups(path="{data}/sriphoosanaphan2021-vitd-hcv/vitd_hcv.csv", outcome="VD_change", group="arm", test="t", paired=False, alternative="two-sided", alpha=0.05, equal_variance=True)The manual route gives the same numbers. An automatic test in Cuvette checks this.
- equal_var =
compare_two_groups(step n4)Code
scipy.stats.ttest_ind(x, y, equal_var=False) # Welch. equal_var=True is Student. scipy.stats.mannwhitneyu(x, y) # rank test- equal_var =
true - alternative =
two-sided
The manual route that the harness recorded
ga_biostats.compare_two_groups(path="{data}/sriphoosanaphan2021-vitd-hcv/vitd_hcv.csv", outcome="TGF_change", group="arm", test="t", paired=False, alternative="two-sided", alpha=0.05, equal_variance=True)The manual route gives the same numbers. An automatic test in Cuvette checks this.
- equal_var =
compare_two_groups(step n5)Code
scipy.stats.ttest_ind(x, y, equal_var=False) # Welch. equal_var=True is Student. scipy.stats.mannwhitneyu(x, y) # rank test- equal_var =
true - alternative =
two-sided
The manual route that the harness recorded
ga_biostats.compare_two_groups(path="{data}/sriphoosanaphan2021-vitd-hcv/vitd_hcv.csv", outcome="TIMP_change", group="arm", test="t", paired=False, alternative="two-sided", alpha=0.05, equal_variance=True)The manual route gives the same numbers. An automatic test in Cuvette checks this.
- equal_var =
compare_two_groups(step n6)Code
scipy.stats.ttest_ind(x, y, equal_var=False) # Welch. equal_var=True is Student. scipy.stats.mannwhitneyu(x, y) # rank test- equal_var =
true - alternative =
two-sided
The manual route that the harness recorded
ga_biostats.compare_two_groups(path="{data}/sriphoosanaphan2021-vitd-hcv/vitd_hcv.csv", outcome="MMP_change", group="arm", test="t", paired=False, alternative="two-sided", alpha=0.05, equal_variance=True)The manual route gives the same numbers. An automatic test in Cuvette checks this.
- equal_var =
compare_two_groups(step n7)Code
scipy.stats.ttest_ind(x, y, equal_var=False) # Welch. equal_var=True is Student. scipy.stats.mannwhitneyu(x, y) # rank test- equal_var =
true - alternative =
two-sided
The manual route that the harness recorded
ga_biostats.compare_two_groups(path="{data}/sriphoosanaphan2021-vitd-hcv/vitd_hcv.csv", outcome="P3NP_change", group="arm", test="t", paired=False, alternative="two-sided", alpha=0.05, equal_variance=True)The manual route gives the same numbers. An automatic test in Cuvette checks this.
- equal_var =
adjust_pvalues(step n8)Code
statsmodels.stats.multitest.multipletests(pvals, alpha=0.05, method='holm')- method =
holm - Warning: If you keep the default hs, you get a different result.
The manual route that the harness recorded
ga_biostats.adjust_pvalues(pvalues=[6.615861523019445e-22, 0.6302215677645985, 0.6000181795891157, 0.20575360709572219, 0.9227679456807509], method="holm", alpha=0.05)The manual route gives the same numbers. An automatic test in Cuvette checks this.
- method =
calculate(step n9)Run the tool "calculate" with these settings: {"items":[{"name":"holm_VD","expression":"6.615861523019445e-22*5"},{"name":"holm_MMP","expression":"0.20575360709572219*4"},{"name":"holm_TIMP","expression":"0.6000181795891157*3"},{"name":"holm_TGF","expression":"0.6302215677645985*2"}]}. - Code only: this step has no route in the program menus. Run it with the script or flow export.The harness recorded no manual route for this step.
Figure
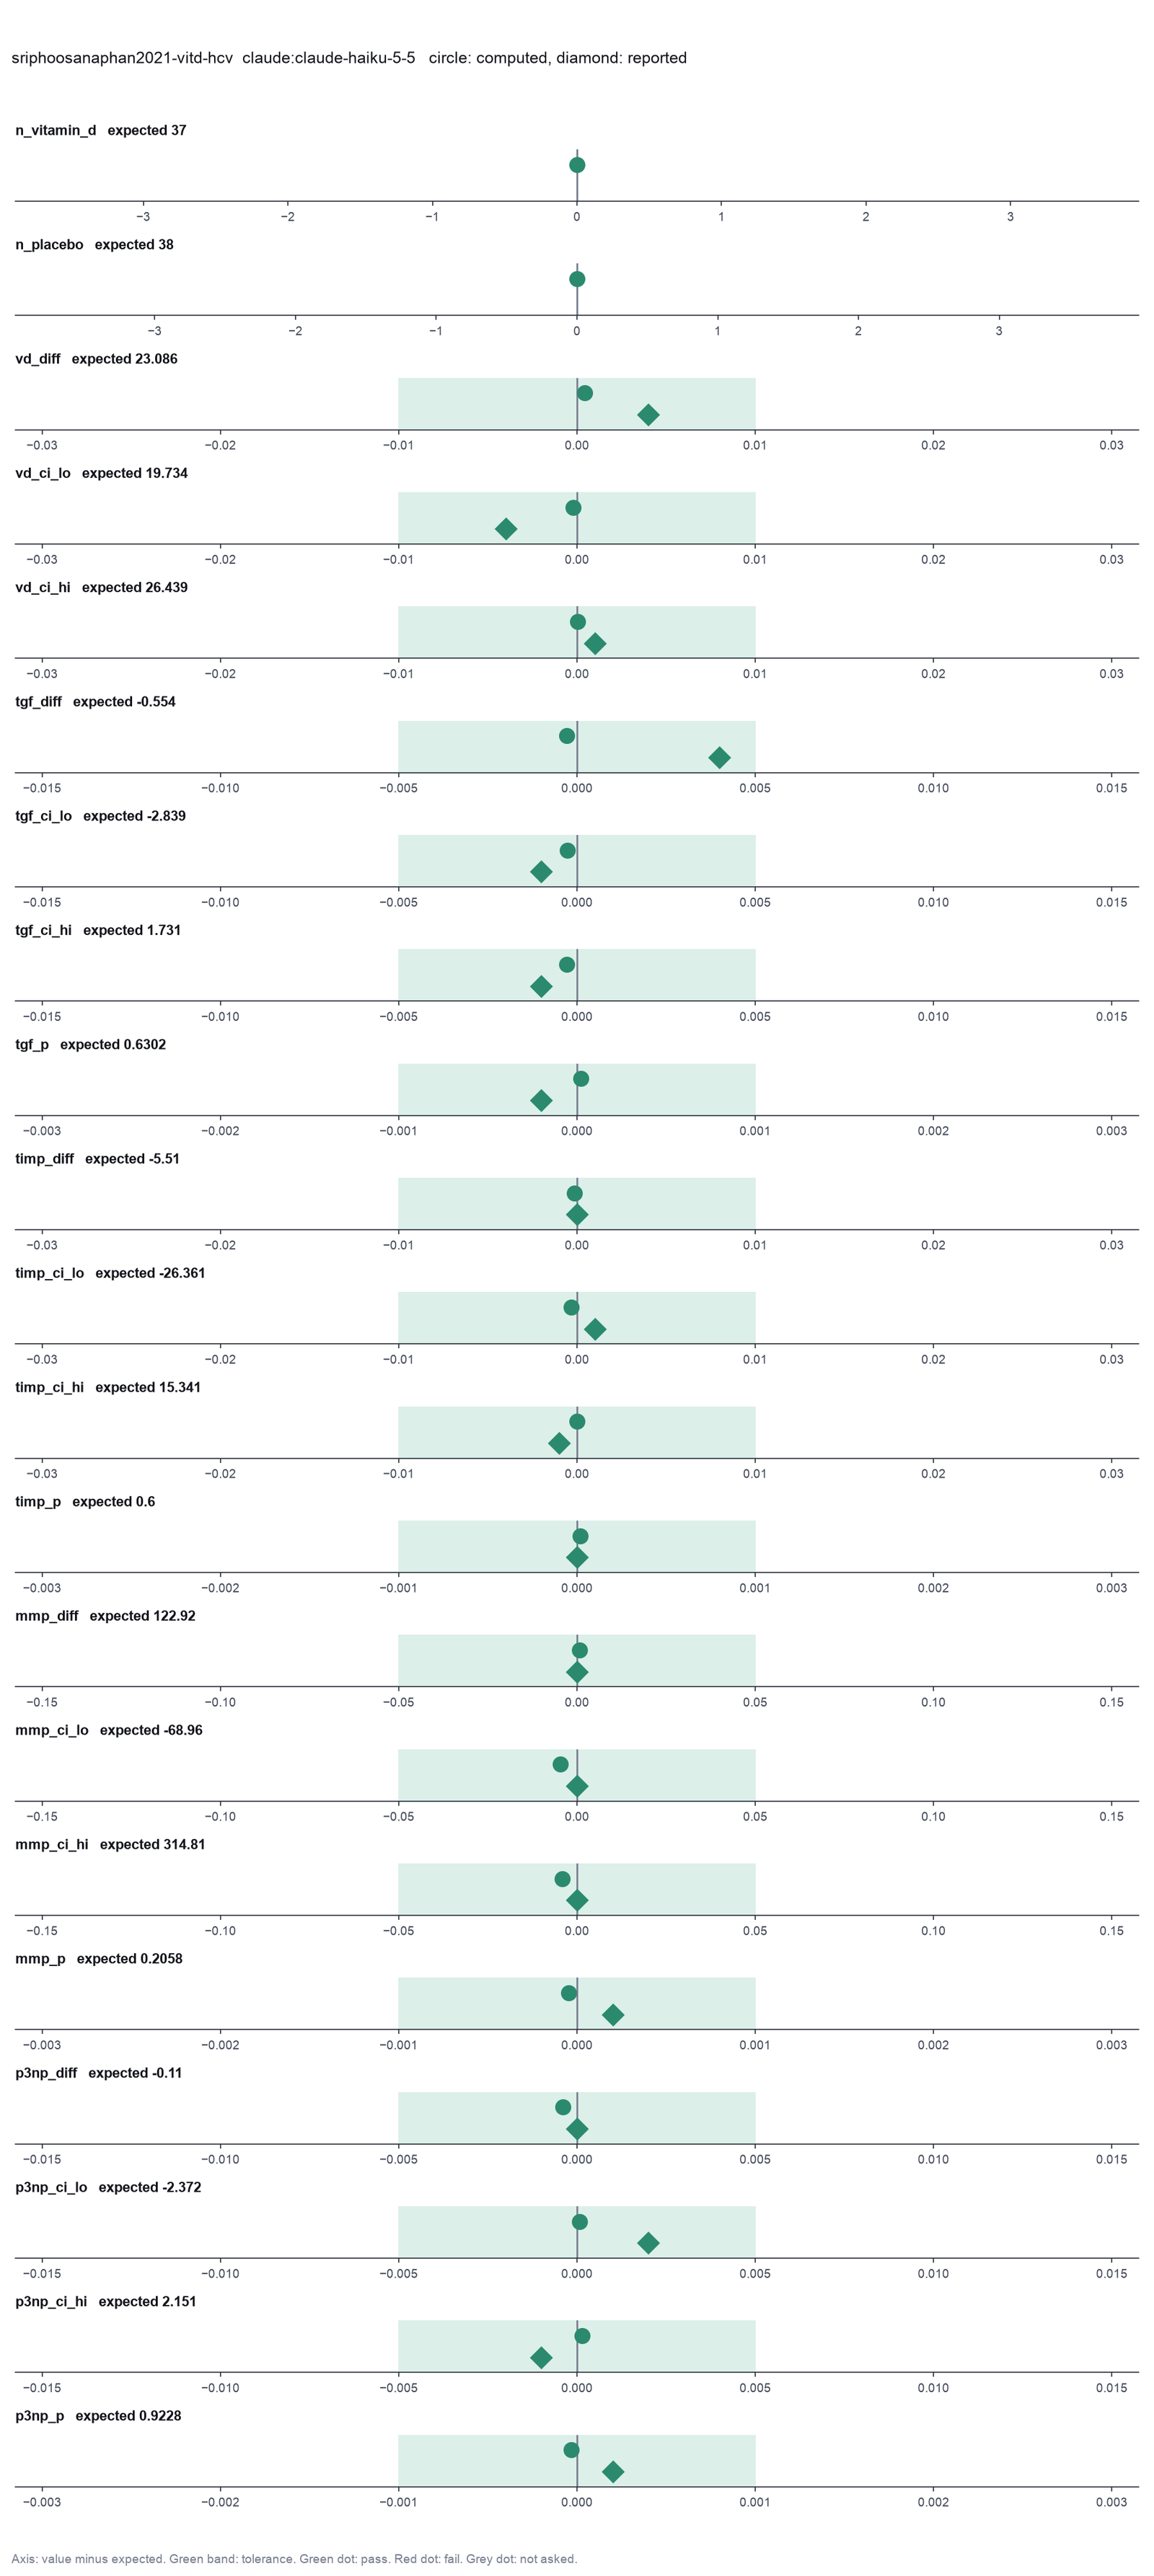
Run facts
| Model | claude-haiku-5-5 through the Anthropic service |
| Date | 2026-10-09 13:18:03 UTC |
| End of run | the model gave a final answer |
| Time | 126 s |
| Requests to the model | 12 |
| Tokensunits of text that the model read and wrote | 30 input, 14489 output, 307771 cache read, 40573 cache write |
| Cost estimate | $0.02 at list price, from the token counts |
| Tool calls | 14 (1 failed) |
| Adapters | biostats 0.2.0, program 0.30.3 |
| Session | 20261009-081803-b20d |
Code hash of each step (9)
| Step | Tool | Program version | Code hash |
|---|---|---|---|
| n1 | inspect_table | 0.30.3 | 603f546a1fe4 |
| n2 | run_script | - | 995d74a3af3a |
| n3 | compare_two_groups | 0.30.3 | 1ad4cb82ccf4 |
| n4 | compare_two_groups | 0.30.3 | 1ad4cb82ccf4 |
| n5 | compare_two_groups | 0.30.3 | 1ad4cb82ccf4 |
| n6 | compare_two_groups | 0.30.3 | 1ad4cb82ccf4 |
| n7 | compare_two_groups | 0.30.3 | 1ad4cb82ccf4 |
| n8 | adjust_pvalues | 0.30.3 | 6cce9d622e70 |
| n9 | calculate | - | d864d37ef90b |
The code hash is a fingerprint of the adapter name, the adapter version, the tool and its definition in the adapter. If one of these changes, the hash changes.
qwen3:8b · local model through Ollama 5 of 21 values match, 3 of 19 correct in the final answer
The session
This is the session as the scientist sees it, in order. Decision cards show the answer that the script gave and where that answer comes from. Each step shows the program, its version, the input file hash and the outputs. Click a line to see more.
setup The decision record starts with these values. A script set them before the first message, from the answers that we wrote before the run.
- Unit of replication: subjects, patients or animals (one value per subject)Where the answer comes from: Patient characteristics section. Each of the 75 randomized patients gives one change for each marker.
- Significance level: 0.05Where the answer comes from: Sample size calculation section. The trial used a two-sided significance level of 5%.
harness note A note from the harness to the model. The scientist did not write it.
- Setup values:
Design:
- What is the unit of replication? (replicate): subjects, patients or animals (one value per subject)
Inference:
- Significance level (alpha) (alpha): 0.05
Ask the scientist: Paired test (paired), Test family for two groups (two_group_test), Assume equal variances (unpaired t-test) (equal_variance), Sidedness (alternative), ANOVA variance assumption (anova_variance), Pairwise comparisons after ANOVA (posthoc), Correction for a list of p-values (p_adjust_method), Model formula (model_formula), Standard errors for the linear model (standard_errors), Random effects of the mixed model (random_effects), Fit by REML (reml), Covariates of the Cox model (cox_covariates), Ties method of the Cox model (ties), Strata of the Cox model (cox_strata), Type of sums of squares (ss_type), Comparisons of the cell means after a factorial ANOVA (factorial_posthoc), Sphericity correction for repeated measures (sphericity_correction), Correction after a rank test over many groups (rank_p_adjust), Exact or approximate p value for a rank test (exact_p), Covariates of the logistic model (logistic_covariates), Outcome value that counts as the event (logistic_event), Reference level of each categorical covariate (reference_levels), Yates continuity correction for a 2x2 chi-square test (chi_square_correction), Sidedness of the Fisher exact test (fisher_alternative), Method of the McNemar test (mcnemar_method).
The harness fills these values into your tool calls automatically. If you give a different value, the harness logs a deviation and shows it to the scientist.
- Mode is now watch: you run the steps.
inspect_table (adapter biostats).step n1 inspect_table adapter biostats 0.2.0, statsmodels, pingouin, lifelines 0.30.3
75 rows x 31 columns.
Input file: {data}/sriphoosanaphan2021-vitd-hcv/vitd_hcv.csv SHA-256 0a0861006d85.
Outputs: columns.csv (e9df16101f7e).
Arguments
| path | {data}/sriphoosanaphan2021-vitd-hcv/vitd_hcv.csv |
Tool output
{
 "ok": true,
 "summary": "75 rows x 31 columns.",
 "metrics": {
  "n_rows": 75,
  "n_columns": 31
 },
 "table": {
  "columns": [
   "column",
   "dtype",
   "n_missing",
   "n_unique",
   "min",
   "max",
   "first_values"
  ],
  "rows": [
   [
    "Case",
    "int64",
    0,
    75,
    1,
    75,
    "1, 2, 3, 4, 5"
   ],
   [
    "arm",
    "object",
    0,
    2,
    null,
    null,
    "vitamin_d, placebo"
   ],
   [
    "Sex",
    "int64",
    0,
    2,
    1,
    2,
    "2, 1"
   ],
   [
    "Age",
    "object",
    0,
    5,
    null,
    null,
    "61-70, 51-60, 71-80, 31-40, 41-50"
   ],
   [
    "BW",
    "float64",
    0,
    58,
    42,
    103,
    "53.5, 73.0, 62.3, 79.0, 75.7"
   ],
   [
    "Height",
    "int64",
    0,
    26,
    144,
    178,
    "160, 161, 153, 169, 178"
   ],
   [
    "BMI",
    "float64",
    0,
    74,
    16.38,
    36.22,
    "20.9, 28.16, 26.61, 27.66, 23.89"
   ],
   [
    "FIB4",
    "float64",
    0,
    72,
    0.64,
    12.56,
    "2.96, 0.98, 7.29, 0.94, 10.42"
   ],
   [
    "APRI",
    "float64",
    0,
    50,
    0.14,
    2.73,
    "0.45, 0.24, 1.35, 0.17, 2.54"
   ],
   [
    "VD0",
    "float64",
    0,
    62,
    8.3,
    24.2,
    "21.7, 11.3, 13.8, 18.3, 12.1"
   ],
   [
    "AST0",
    "int64",
    0,
    34,
    13,
    103,
    "26, 24, 42, 13, 64"
   ],
   [
    "ALT0",
    "float64",
    0,
    35,
    5,
    49,
    "18.0, 26.0, 14.0, 32.0, 7.0"
   ],
   [
    "Plt0",
    "int64",
    0,
    64,
    43,
    357,
    "143, 250, 78, 195, 63"
   ],
   [
    "VD6",
    "float64",
    0,
    71,
    7.8,
    64.3,
    "38.5, 40.1, 15.1, 16.6, 53.2"
   ],
   [
    "AST6",
    "int64",
    0,
    35,
    10,
    100,
    "42, 24, 43, 15, 40"
   ]
  ],
  "n_rows": 31,
  "path": "{work}/inspect_table-1/columns.csv"
 }
}compare_two_groups (adapter biostats).paused The harness paused compare_two_groups until the scientist chose: Paired or unpaired test, Test family for two groups, Equal variances for an unpaired test, Sidedness. The decision cards follow.
decision card Paired test
Use a paired test if the same subject is measured in both groups (before and after, or both drugs in one patient). Use an unpaired test if the groups hold different subjects. The two choices can give different conclusions. The model wants to run compare_two_groups.
Options: yes no
Suggested: false (The model proposed this value when it asked to run the step.)
Answer false
No person answered in this run. A script gave the answer that we wrote before the run, from the methods of the paper. Where the answer comes from: Statistical analysis section. The test compares the change in the vitamin D arm with the change in the placebo arm. The arms hold different patients. The pairing of baseline and week 6 is already in the change column.
decision card Test family for two groups
t is the t-test. It compares means and gives a confidence interval. wilcoxon is the rank test (signed-rank if paired, Mann-Whitney if unpaired). Use it if the data are far from normal or have outliers. The model wants to run compare_two_groups.
Options: t wilcoxon
Suggested: t (The model proposed this value when it asked to run the step.)
Answer t
No person answered in this run. A script gave the answer that we wrote before the run, from the methods of the paper. Where the answer comes from: Statistical analysis section, "the independent t-test". The quantile regression in Table 4 is a sensitivity analysis.
decision card Assume equal variances (unpaired t-test)
False gives the Welch test. It does not assume equal variances. True gives the Student test. Student's test is correct only if the group variances are equal. The model wants to run compare_two_groups.
Options: yes no
Suggested: true (The model proposed this value when it asked to run the step.)
Answer true
No person answered in this run. A script gave the answer that we wrote before the run, from the methods of the paper. Where the answer comes from: Not stated in the paper. The paper used Stata 16.1, whose ttest command assumes equal variances by default. The Student test reproduces the printed upper bound for 25(OH)D (26.4). The Welch test gives 26.5.
decision card Sidedness
Two-sided tests for a difference in either direction. One-sided tests for one direction only (the second group greater than the first, or less). Choose a one-sided test only if the other direction is not of interest, and decide before you see the data. The model wants to run compare_two_groups.
Options: two-sided greater less
Suggested: two-sided (The model proposed this value when it asked to run the step.)
Answer two-sided
No person answered in this run. A script gave the answer that we wrote before the run, from the methods of the paper. Where the answer comes from: Sample size calculation section, "a 2-sided significance level of 5%".
step n2 compare_two_groups adapter biostats 0.2.0, statsmodels, pingouin, lifelines 0.30.3
Student t-test (equal variances), two-sided: vitamin_d minus placebo = 23.09, statistic 13.72, p = 6.616e-22 (alpha 0.05).
Decisions applied: Significance level = 0.05; Paired or unpaired test = false; Test family for two groups = t; Equal variances for an unpaired test = true; Sidedness = two-sided.
Input file: {data}/sriphoosanaphan2021-vitd-hcv/vitd_hcv.csv SHA-256 0a0861006d85.
Outputs: two_group_test.csv (1c3c06d39752).
Arguments
| alpha | 0.05 |
| alternative | two-sided |
| equal_variance | true |
| path | {data}/sriphoosanaphan2021-vitd-hcv/vitd_hcv.csv |
| outcome | VD_change |
| group | arm |
| paired | false |
| test | t |
Tool output
{
 "ok": true,
 "summary": "Student t-test (equal variances), two-sided: vitamin_d minus placebo = 23.09, statistic 13.72, p = 6.616e-22 (alpha 0.05).",
 "metrics": {
  "n_a": 38,
  "n_b": 37,
  "mean_diff": 23.086415362731152,
  "statistic": 13.723934695158828,
  "df": 73,
  "p_value": 6.615861523019445e-22,
  "ci_lo": 19.733793794132957,
  "ci_hi": 26.439036931329348,
  "effect_size": 3.1696887188680014,
  "mean_a": 1.4973684210526317,
  "mean_b": 24.583783783783783
 },
 "data": {
  "test": "Student t-test (equal variances)",
  "alternative": "two-sided",
  "direction": "vitamin_d minus placebo",
  "alpha": 0.05,
  "significant": true
 },
 "table": {
  "columns": [
   "test",
   "group_a",
   "group_b",
   "n_a",
   "n_b",
   "mean_diff_b_minus_a",
   "statistic",
   "df",
   "p",
   "ci_lo",
   "ci_hi",
   "cohen_d"
  ],
  "rows": [
   [
    "Student t-test (equal variances)",
    "placebo",
    "vitamin_d",
    38,
    37,
    23.086415362731152,
    13.723934695158828,
    73,
    6.615861523019445e-22,
    19.733793794132957,
    26.439036931329348,
    3.1696887188680014
   ]
  ],
  "n_rows": 1,
  "path": "{work}/compare_two_groups-1/two_group_test.csv"
 }
}
Model The model writes its answer. The claim check reads it. See the final answer.
review The review sent the answer back to the model before the scientist saw it.
- The p-value must be reported with the test name, sidedness, and alpha.
Fix these problems. Then give the answer again.
Model The model writes its answer. The claim check reads it. See the final answer.
The final answer
The model wrote this answer. The harness shows it to the scientist after the review.
The vitamin D group had a significantly higher mean change in 25(OH)D compared to the placebo group. The difference in the mean change from baseline was 23.09 ng/mL (95% confidence interval: 19.73 to 26.44 ng/mL), with a p-value of 6.62e-22. This indicates a statistically significant increase in 25(OH)D levels with vitamin D supplementation.
Settings and step results that the answer does not mention. The harness adds them.
Step results that the answer does not mention, from the record:
- n1 inspect_table: 75 rows x 31 columns.

Settings used, from the decision record: Significance level (alpha): 0.05 · Paired test: false · Test family for two groups: t · Assume equal variances (unpaired t-test): true · Sidedness: two-sided.
Values that are not scored
- A trap value is the result of a wrong method, for example an unpaired test on paired data. A trap value in a main step means that the run used the wrong method. A trap value in a comparison run is correct, because the record keeps the scientist's choice.
- An optional value is a second result of the same method. The run can compute it or not.
- A reference value comes from a different program version or a check run by us. We show it for comparison.
| Item | Kind | Known value | Closest logged value | Tolerance | Outcome | Source of the known value |
|---|---|---|---|---|---|---|
mmp_week6_trapMMP-9 at week 6 only, vitamin D minus placebo (trap result) | trap | 129.06 | 144n1 inspect_table | ± 0.05 | not in the record | We calculated it with SciPy ttest_ind with equal_var=True on MMP6 |
Checks
Review findings
The review recorded 4 findings. A rule finding comes from a fixed check in the harness. A referee finding comes from a second model that reads the record. The harness shows the findings to the scientist with the final answer. The record does not mark a finding as fixed. Thus a finding from an early review round can apply to a draft that the model corrected later.
| Severity | From | Finding | Shown with the final answer |
|---|---|---|---|
| warning | rulep_without_effect | The answer reports a p or q value with no effect size. Add the size of the difference. | yes |
| warning | ruleid_column_missing | Name the subject column. A test with no subject column cannot warn that the same subjects are in both groups. | yes |
| info | ruletext_style | The answer breaks the text rules (ASD-STE100) in 1 place. Sentence 3 uses "indicates". Use "shows". | yes |
| error | referee model | The p-value must be reported with the test name, sidedness, and alpha. | yes |
Numbers in the answer
The last claim check read 6 numbers in the answer. 6 numbers match a logged result. 0 numbers have no source in the record.
Deviations
The model did not try to change a choice of the scientist.
Failed tool calls
No tool call failed.
Data integrity
Each data file has the same SHA-256 hash now as at the time of the step that read it. Where the download script (fetch.sh) gives a hash, the file also has that hash. The run did not change the data.
| File | SHA-256 | Fetched data | Steps with this hash |
|---|---|---|---|
{data}/sriphoosanaphan2021-vitd-hcv/vitd_hcv.csv11.8 KB | 0a0861006d85 | same as the hash in the download script (fetch.sh) | n1, n2 |
A SHA-256 hash is a fingerprint of the file contents. If one byte of the file changes, the hash changes. The table shows the first 12 characters.
How to repeat it
Get the data. The script downloads the files and checks their SHA-256 hashes where it lists them.
CUVETTE_DATA={data} bash bench/papers/sriphoosanaphan2021-vitd-hcv/fetch.shRun the same case with Cuvette. The script gives the same answers from bench/papers/sriphoosanaphan2021-vitd-hcv/bench.yaml.
cuvette bench papers --papers sriphoosanaphan2021-vitd-hcv --models ollama:qwen3:8b
Repeat each step by hand in the program. For each step, the harness records a manual route: the menu path or the code that gives the same result. This list does not include comparison runs.
inspect_table(step n1)Code
print(pd.read_csv(path).describe(include='all'))path
{data}/sriphoosanaphan2021-vitd-hcv/vitd_hcv.csv- Note: The tool also counts distinct values and missing values for each column.
The manual route that the harness recorded
ga_biostats.inspect_table(path="{data}/sriphoosanaphan2021-vitd-hcv/vitd_hcv.csv")The manual route uses the same method. The note in the route gives the known difference.
compare_two_groups(step n2)Code
scipy.stats.ttest_ind(x, y, equal_var=False) # Welch. equal_var=True is Student. scipy.stats.mannwhitneyu(x, y) # rank test- equal_var =
true - alternative =
two-sided
The manual route that the harness recorded
ga_biostats.compare_two_groups(path="{data}/sriphoosanaphan2021-vitd-hcv/vitd_hcv.csv", outcome="VD_change", group="arm", test="t", paired=False, alternative="two-sided", alpha=0.05, equal_variance=True)The manual route gives the same numbers. An automatic test in Cuvette checks this.
- equal_var =
Figure
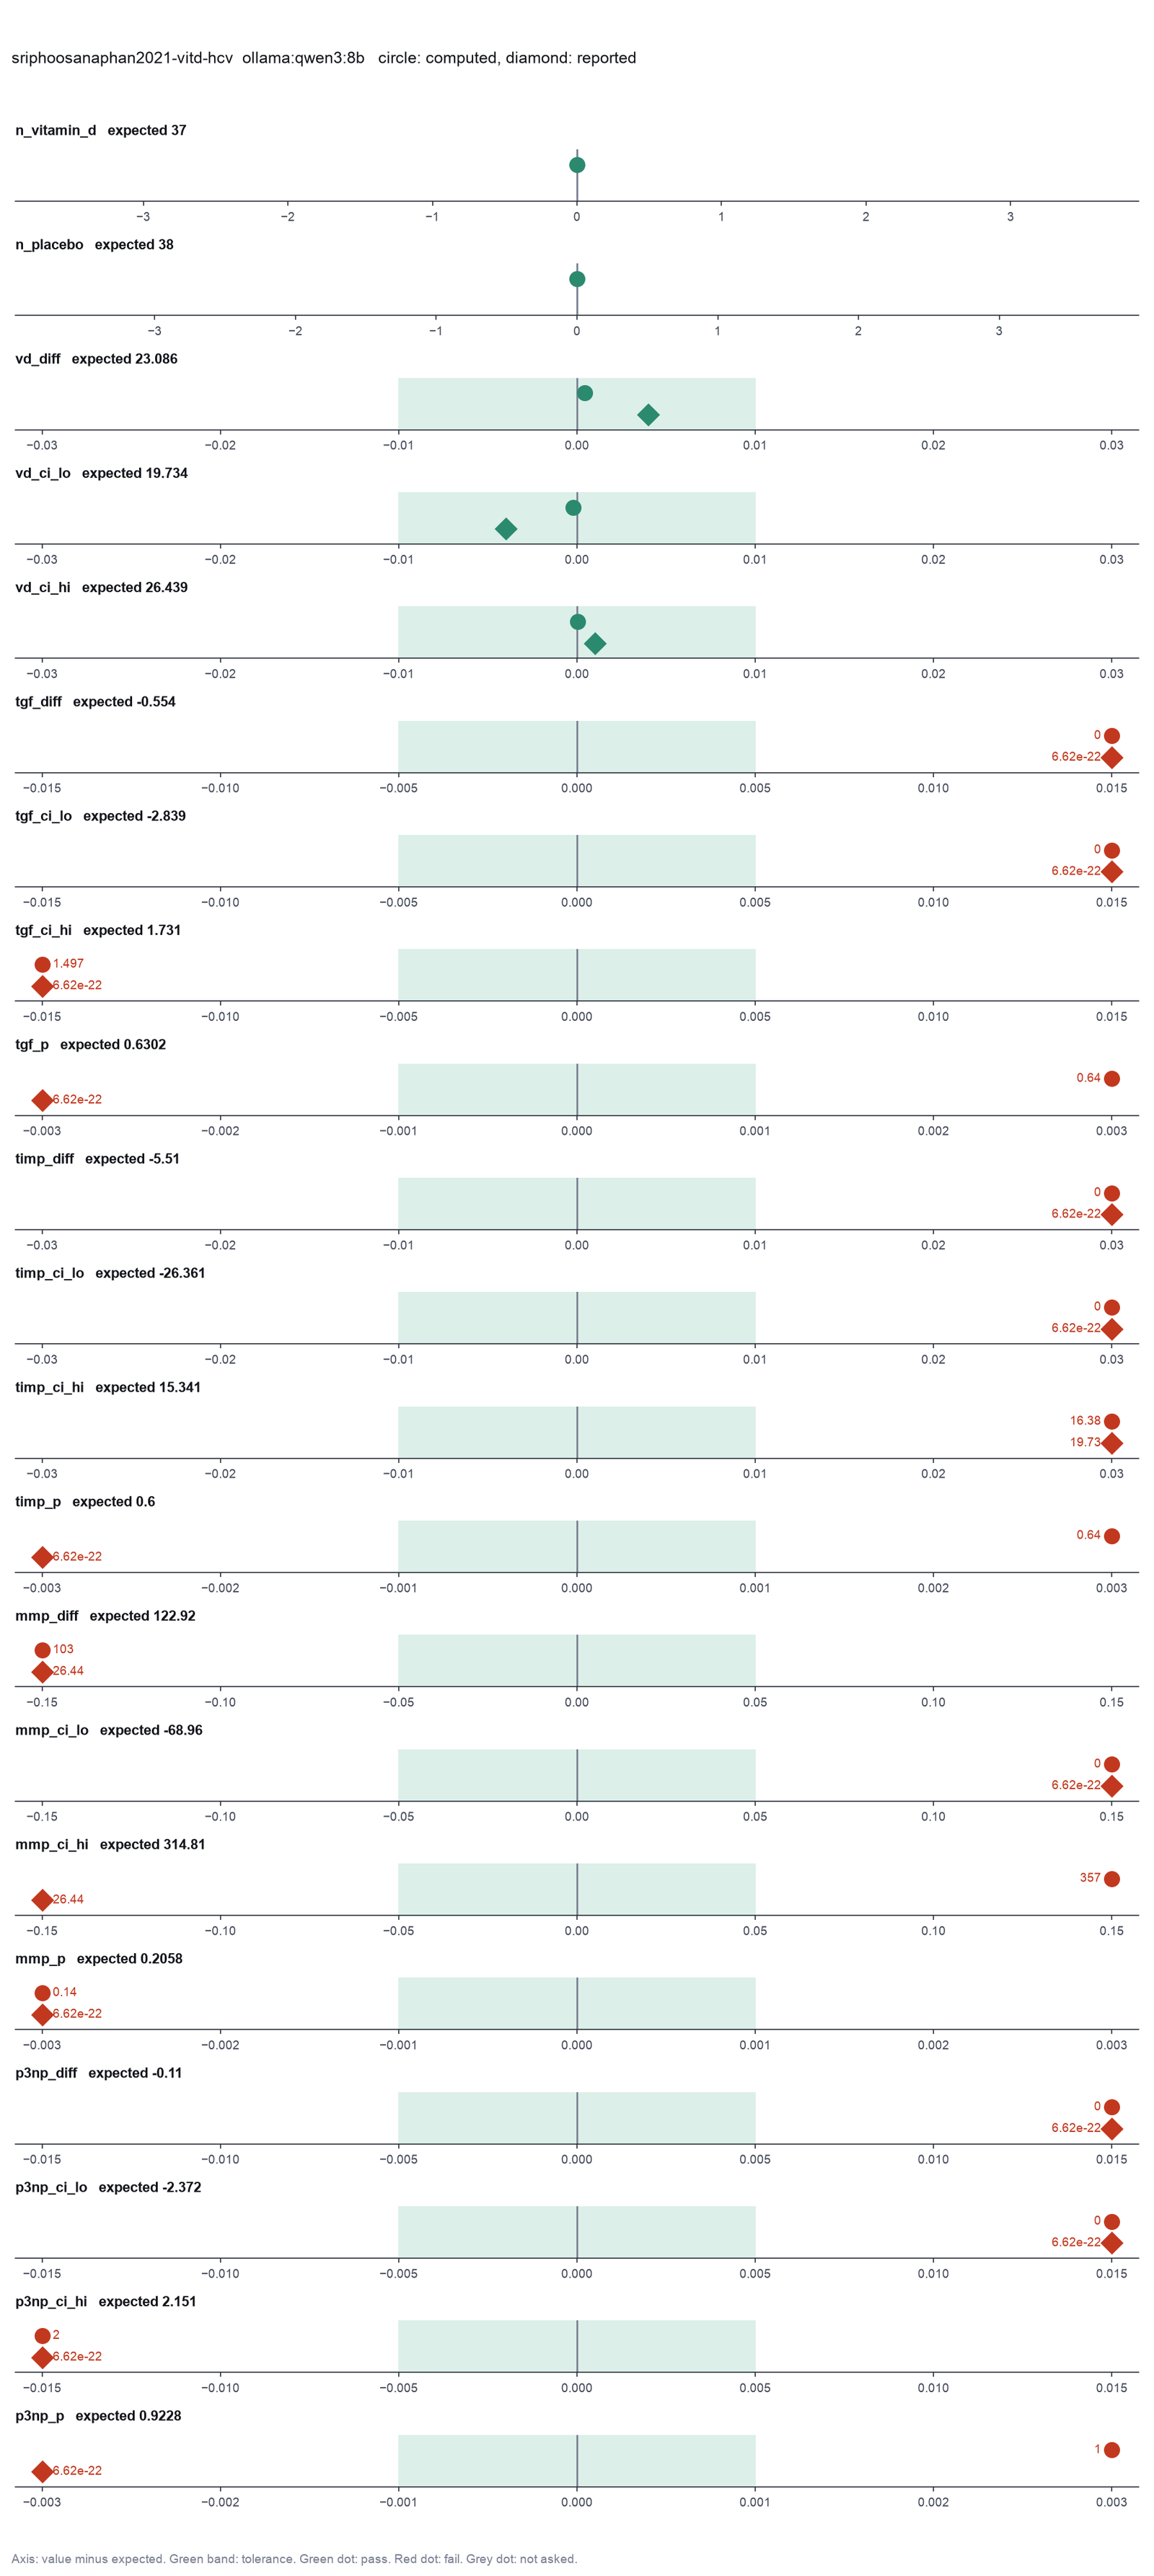
Run facts
| Model | qwen3:8b through Ollama, on our own computer |
| Date | 2026-10-09 11:43:53 UTC |
| End of run | the model gave a final answer |
| Time | 85 s |
| Requests to the model | 4 |
| Tokensunits of text that the model read and wrote | 41217 input, 334 output, 0 cache read, 0 cache write |
| Cost estimate | none: the model runs on our own computer |
| Tool calls | 2 (0 failed) |
| Adapters | biostats 0.2.0, program 0.30.3 |
| Session | 20261009-064352-8abc |
Code hash of each step (2)
| Step | Tool | Program version | Code hash |
|---|---|---|---|
| n1 | inspect_table | 0.30.3 | 603f546a1fe4 |
| n2 | compare_two_groups | 0.30.3 | 1ad4cb82ccf4 |
The code hash is a fingerprint of the adapter name, the adapter version, the tool and its definition in the adapter. If one of these changes, the hash changes.