Validation / Papers / Student 1908
Student 1908: paired t-test on the Cushny and Peebles sleep data
How to read this page
In this validation, a script plays the scientist. It gives the answers that we wrote before the run, from the methods of the paper. The run is one sample: another run can give different steps and numbers. The model is the AI. The harness is Cuvette, the software around the model: it runs the programs and records each step. A tool call is a request from the model to run one program step. The session record is the log of each message and each step. The claim check is a script that finds each number of the final answer in the step results. The review is a set of fixed rule checks plus a second AI model, the referee, that reads the record. A deviation is a request from the model for a setting that differs from the choice of the scientist. Each Claude model did 3 runs of this paper. This page shows run 3 of each Claude model and the one run of qwen3:8b. The table of values says how many of the Claude runs match.
Opus: 6 of 6 values match, 4 of 4 correct in the final answer. All 3 runs: 6 of 6 values match. Sonnet: 6 of 6 values match, 4 of 4 correct in the final answer. All 3 runs: 6 of 6 values match. Haiku: 6 of 6 values match, 4 of 4 correct in the final answer. All 3 runs: 6 of 6 values match. qwen3:8b: 6 of 6 values match, 4 of 4 correct in the final answer.
The figure in the paper and in the run
As published
Illustration I of Student (1908). The paper gives the extra sleep of the 10 patients in a table, not in a figure. The table is the source of our values.
Reproduced in Cuvette
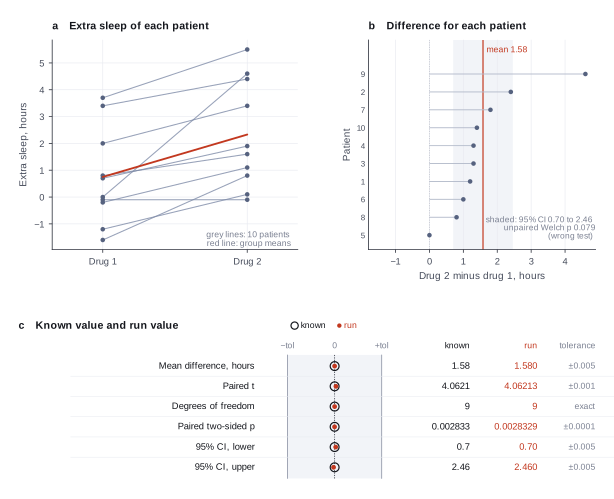
The paper
Student (William Sealy Gosset). The probable error of a mean. Biometrika 6(1):1-25 (1908). doi:10.2307/2331554
Related sources:
- Cushny AR, Peebles AR. The action of optical isomers II: hyoscines. Journal of Physiology 32:501-510 (1905). Source of the sleep data. doi:10.1113/jphysiol.1905.sp001097
What it measured
Ten patients each took two forms of the drug hyoscyamine on different nights. The table gives the hours of sleep that each drug added, for each patient. Student used these data to show his method for a small sample. He took the difference between the two drugs for each patient and asked if the mean difference is greater than zero. The paired difference removes the variation between patients, so the test is much more sensitive than a comparison of the two groups as independent samples.
Data
R dataset sleep, from the Rdatasets collection. Size: 238 bytes, 20 rows.
License: The 1905 measurements are historic published data. The Rdatasets collection is GPL-3. The file has no patient identifiers.
The instruction
A script sent this message as the scientist. The file paths point to the fetched data.
The same request in the words of the paper's method:
Ten patients each took both sleeping drugs. For each patient, compare the extra sleep on drug 2 with the extra sleep on drug 1. Is drug 2 better? Give me the mean difference, a 95% confidence interval and a two-sided p-value.
Basis: Illustration I of the paper. Student subtracts the result of drug 1 from the result of drug 2 for each patient and tests the mean of these differences.
Results
Match: a number in the session record is inside the tolerance of the known value. In the final answer: the model also stated the value in its final answer. For a Claude model, each cell shows the run that this page shows. If the three runs differ, the cell also says in how many runs the value matches.
| Value | Known value | Tolerance | Opus | Sonnet | Haiku | qwen3:8b |
|---|---|---|---|---|---|---|
mean_differenceMean paired difference, group 2 minus group 1Source of the known valuePrinted in the paperIllustration I, the table of the ten patients. The mean of the differences is +1.58 hours. | 1.58 | ± 0.005 | 1.58 matchIn the final answer: yes (1.58)Log: n2 compare_two_groups metrics.mean_diff, entry 40; the final answer, entry 66 | 1.58 matchIn the final answer: yes (1.58)Log: n2 compare_two_groups metrics.mean_diff, entry 32; the final answer, entry 39 | 1.58 matchIn the final answer: yes (1.58)Log: n2 compare_two_groups metrics.mean_diff, entry 42; the final answer, entry 56 | 1.58 matchIn the final answer: yes (1.58)Log: n2 compare_two_groups metrics.mean_diff, entry 29; the final answer, entry 36 |
paired_tPaired t statistic, absolute valueSource of the known valueWe calculated it with SciPy 1.x ttest_relNot in this form in the paper. Student gives the mean as 1.35 times the standard deviation, with n as the divisor. The modern t statistic uses n - 1. | abs 4.0621 | ± 0.001 | 4.062128 matchNot asked in the questionLog: n2 compare_two_groups metrics.statistic, entry 40 | 4.062128 matchNot asked in the questionLog: n2 compare_two_groups metrics.statistic, entry 32 | 4.062128 matchNot asked in the questionLog: n2 compare_two_groups metrics.statistic, entry 42 | 4.062128 matchNot asked in the questionLog: n2 compare_two_groups metrics.statistic, entry 29 |
degrees_of_freedomDegrees of freedomSource of the known valueWe calculated it with SciPy 1.x ttest_relNot in the paper. Student indexes his table by the number of experiments (10). | 9 | exact | 9 matchNot asked in the questionLog: n2 compare_two_groups metrics.df, entry 40 | 9 matchNot asked in the questionLog: n2 compare_two_groups metrics.df, entry 32 | 9 matchNot asked in the questionLog: n2 compare_two_groups metrics.df, entry 42 | 9 matchNot asked in the questionLog: n2 compare_two_groups metrics.df, entry 29 |
paired_pPaired two-sided pSource of the known valueWe calculated it with SciPy 1.x ttest_relNot in the paper. Student gives a probability of 0.9985 (odds of about 666 to 1) that drug 2 is better, from his own table. | 0.002833 | ± 0.0001 | 0.00283289 matchIn the final answer: yes (0.0028)Log: n2 compare_two_groups metrics.p_value, entry 40; the final answer, entry 66 | 0.00283289 matchIn the final answer: yes (0.002833)Log: n2 compare_two_groups metrics.p_value, entry 32; the final answer, entry 39 | 0.00283289 matchIn the final answer: yes (0.0028)Log: n2 compare_two_groups metrics.p_value, entry 42; the final answer, entry 56 | 0.00283289 matchIn the final answer: yes (0.0028)Log: n2 compare_two_groups metrics.p_value, entry 29; the final answer, entry 36 |
ci_lower95% CI lower boundSource of the known valueWe calculated it with SciPy 1.xNot in the paper. Student does not give a confidence interval. | 0.7 | ± 0.005 | 0.7 matchIn the final answer: yes (0.7)Log: n1 inspect_table file:{work}/inspect_table-1/columns.csv, entry 13; the final answer, entry 66 | 0.7001142 matchIn the final answer: yes (0.7)Log: n2 compare_two_groups metrics.ci_lo, entry 32; the final answer, entry 39 | 0.7 matchIn the final answer: yes (0.7)Log: n1 inspect_table file:{work}/inspect_table-1/columns.csv, entry 11; the final answer, entry 56 | 0.7001142 matchIn the final answer: yes (0.7)Log: n2 compare_two_groups metrics.ci_lo, entry 29; the final answer, entry 36 |
ci_upper95% CI upper boundSource of the known valueWe calculated it with SciPy 1.xNot in the paper. Student does not give a confidence interval. | 2.46 | ± 0.005 | 2.459886 matchIn the final answer: yes (2.46)Log: n2 compare_two_groups metrics.ci_hi, entry 40; the final answer, entry 66 | 2.459886 matchIn the final answer: yes (2.46)Log: n2 compare_two_groups metrics.ci_hi, entry 32; the final answer, entry 39 | 2.459886 matchIn the final answer: yes (2.46)Log: n2 compare_two_groups metrics.ci_hi, entry 42; the final answer, entry 56 | 2.459886 matchIn the final answer: yes (2.46)Log: n2 compare_two_groups metrics.ci_hi, entry 29; the final answer, entry 36 |
Session records
Session record, Opus, run 3 of 3
Every message, decision, step and result of this run, one JSON object for each log entry.
Session record, Sonnet, run 3 of 3
Every message, decision, step and result of this run, one JSON object for each log entry.
Session record, Haiku, run 3 of 3
Every message, decision, step and result of this run, one JSON object for each log entry.
Session record, qwen3:8b
Every message, decision, step and result of this run, one JSON object for each log entry.
Opus · claude-opus-5-5 · run 3 of 3 shown 6 of 6 values match, 4 of 4 correct in the final answer
The session
This is the session as the scientist sees it, in order. Decision cards show the answer that the script gave and where that answer comes from. Each step shows the program, its version, the input file hash and the outputs. Click a line to see more.
setup The decision record starts with these values. A script set them before the first message, from the answers that we wrote before the run.
- Unit of replication: subjects, patients or animals (one value per subject)Where the answer comes from: Illustration I. Each of the ten patients gives one result for each drug.
- Significance level: 0.05Where the answer comes from: Not in the paper. Student gives odds, not a fixed level. We use the usual 0.05.
harness note A note from the harness to the model. The scientist did not write it.
- Setup values:
Design:
- What is the unit of replication? (replicate): subjects, patients or animals (one value per subject)
Inference:
- Significance level (alpha) (alpha): 0.05
Ask the scientist: Paired test (paired), Test family for two groups (two_group_test), Assume equal variances (unpaired t-test) (equal_variance), Sidedness (alternative), ANOVA variance assumption (anova_variance), Pairwise comparisons after ANOVA (posthoc), Correction for a list of p-values (p_adjust_method), Model formula (model_formula), Standard errors for the linear model (standard_errors), Random effects of the mixed model (random_effects), Fit by REML (reml), Covariates of the Cox model (cox_covariates), Ties method of the Cox model (ties), Strata of the Cox model (cox_strata), Type of sums of squares (ss_type), Comparisons of the cell means after a factorial ANOVA (factorial_posthoc), Sphericity correction for repeated measures (sphericity_correction), Correction after a rank test over many groups (rank_p_adjust), Exact or approximate p value for a rank test (exact_p), Covariates of the logistic model (logistic_covariates), Outcome value that counts as the event (logistic_event), Reference level of each categorical covariate (reference_levels), Yates continuity correction for a 2x2 chi-square test (chi_square_correction), Sidedness of the Fisher exact test (fisher_alternative), Method of the McNemar test (mcnemar_method).
The harness fills these values into your tool calls automatically. If you give a different value, the harness logs a deviation and shows it to the scientist.
- Mode is now watch: you run the steps.
Model thinking, summary: I'm going to start by loading the skill and taking a look at the table.
Model
I start with the skill for two-group tests and a look at the table.
compare-two-groups.inspect_table (adapter biostats).step n1 inspect_table adapter biostats 0.2.0, statsmodels, pingouin, lifelines 0.30.3
20 rows x 4 columns.
Input file: {data}/student1908-sleep/sleep.csv SHA-256 5563ff4da6cf.
Outputs: columns.csv (0b88fe23ba8b).
Arguments
| path | {data}/student1908-sleep/sleep.csv |
Tool output
{
 "ok": true,
 "summary": "20 rows x 4 columns.",
 "metrics": {
  "n_rows": 20,
  "n_columns": 4
 },
 "table": {
  "columns": [
   "column",
   "dtype",
   "n_missing",
   "n_unique",
   "min",
   "max",
   "first_values"
  ],
  "rows": [
   [
    "rownames",
    "int64",
    0,
    20,
    1,
    20,
    "1, 2, 3, 4, 5"
   ],
   [
    "extra",
    "float64",
    0,
    17,
    -1.6,
    5.5,
    "0.7, -1.6, -0.2, -1.2, -0.1"
   ],
   [
    "group",
    "int64",
    0,
    2,
    1,
    2,
    "1, 2"
   ],
   [
    "ID",
    "int64",
    0,
    10,
    1,
    10,
    "1, 2, 3, 4, 5"
   ]
  ],
  "n_rows": 4,
  "path": "{work}/inspect_table-1/columns.csv"
 }
}
Model thinking, summary: The table isn't shown directly, so I need to check columns.csv instead.
read_file.Result of read_file: Read 226 of 226 bytes from {work}/inspect_table-1/columns.csv.
column,dtype,n_missing,n_unique,min,max,first_values
rownames,int64,0,20,1.0,20.0,"1, 2, 3, 4, 5"
extra,float64,0,17,-1.6,5.5,"0.7, -1.6, -0.2, -1.2, -0.1"
group,int64,0,2,1.0,2.0,"1, 2"
ID,int64,0,10,1.0,10.0,"1, 2, 3, 4, 5"
Model thinking, summary: With 20 rows across 10 IDs in 2 groups, each ID appears in both groups, so this is a paired design. I'll use compare_two_groups with the id_column specified.
Model thinking, summary: The table shows 10 patients each with values for both drug groups, confirming a paired design with no missing data. I'll now run the two-group test including patient ID so the harness can apply the correct pairing, test family, and sidedness.
compare_two_groups (adapter biostats).paused The harness paused compare_two_groups until the scientist chose: Paired or unpaired test, Test family for two groups, Equal variances for an unpaired test, Sidedness. The decision cards follow.
decision card Paired test
Use a paired test if the same subject is measured in both groups (before and after, or both drugs in one patient). Use an unpaired test if the groups hold different subjects. The two choices can give different conclusions. The model wants to run compare_two_groups.
Options: yes no
Answer true
No person answered in this run. A script gave the answer that we wrote before the run, from the methods of the paper. Where the answer comes from: Illustration I. Student makes a new series of differences, drug 2 minus drug 1, for each patient. He notes that the same patient reacts in a similar way to both drugs.
decision card Test family for two groups
t is the t-test. It compares means and gives a confidence interval. wilcoxon is the rank test (signed-rank if paired, Mann-Whitney if unpaired). Use it if the data are far from normal or have outliers. The model wants to run compare_two_groups.
Options: t wilcoxon
Suggested: t (This is the adapter default.)
Answer t
No person answered in this run. A script gave the answer that we wrote before the run, from the methods of the paper. Where the answer comes from: Illustration I. Student uses his own distribution for the mean of a small sample. A rank test is not in the paper.
decision card Assume equal variances (unpaired t-test)
False gives the Welch test. It does not assume equal variances. True gives the Student test. Student's test is correct only if the group variances are equal. The model wants to run compare_two_groups.
Options: yes no
Suggested: false (This is the adapter default.)
Answer false
No person answered in this run. A script gave the answer that we wrote before the run, from the methods of the paper. Where the answer comes from: Not used. A paired test has one series of differences. The value only applies to an unpaired test.
decision card Sidedness
Two-sided tests for a difference in either direction. One-sided tests for one direction only (the second group greater than the first, or less). Choose a one-sided test only if the other direction is not of interest, and decide before you see the data. The model wants to run compare_two_groups.
Options: two-sided greater less
Suggested: two-sided (This is the adapter default.)
Answer two-sided
No person answered in this run. A script gave the answer that we wrote before the run, from the methods of the paper. Where the answer comes from: The modern convention. Student gives the probability that drug 2 is better, which is one direction.
step n2 compare_two_groups adapter biostats 0.2.0, statsmodels, pingouin, lifelines 0.30.3
paired t-test, two-sided: 2 minus 1 = 1.58, statistic 4.062, p = 0.002833 (alpha 0.05).
Decisions applied: Significance level = 0.05; Paired or unpaired test = true; Test family for two groups = t; Equal variances for an unpaired test = false; Sidedness = two-sided.
Input file: {data}/student1908-sleep/sleep.csv SHA-256 5563ff4da6cf.
Outputs: two_group_test.csv (5c80e8fb3427).
Arguments
| path | {data}/student1908-sleep/sleep.csv |
| outcome | extra |
| group | group |
| id_column | ID |
| paired | true |
| test | t |
| equal_variance | false |
| alternative | two-sided |
| alpha | 0.05 |
Tool output
{
 "ok": true,
 "summary": "paired t-test, two-sided: 2 minus 1 = 1.58, statistic 4.062, p = 0.002833 (alpha 0.05).",
 "metrics": {
  "n_a": 10,
  "n_b": 10,
  "mean_diff": 1.58,
  "statistic": 4.062127683382037,
  "df": 9,
  "p_value": 0.0028328901973842724,
  "ci_lo": 0.7001142367230175,
  "ci_hi": 2.459885763276983,
  "effect_size": 1.2845575625910546,
  "mean_a": 0.75,
  "mean_b": 2.3299999999999996
 },
 "data": {
  "test": "paired t-test",
  "alternative": "two-sided",
  "direction": "2 minus 1",
  "alpha": 0.05,
  "significant": true
 },
 "table": {
  "columns": [
   "test",
   "group_a",
   "group_b",
   "n_a",
   "n_b",
   "mean_diff_b_minus_a",
   "statistic",
   "df",
   "p",
   "ci_lo",
   "ci_hi",
   "cohen_dz"
  ],
  "rows": [
   [
    "paired t-test",
    1,
    2,
    10,
    10,
    1.58,
    4.062127683382037,
    9,
    0.0028328901973842724,
    0.7001142367230175,
    2.459885763276983,
    1.2845575625910546
   ]
  ],
  "n_rows": 1,
  "path": "{work}/compare_two_groups-1/two_group_test.csv"
 }
}
Model
The harness applied a paired, two-sided t-test at alpha 0.05. As a check without the normal assumption, I run the signed-rank test as a comparison run. This does not change the record.
compare_options.comparison run n3 compare_two_groups adapter biostats 0.2.0, statsmodels, pingouin, lifelines 0.30.3
Wilcoxon signed-rank test, two-sided: 2 minus 1 = 1.58, statistic 0, p = 0.003906 (alpha 0.05).
Input file: {data}/student1908-sleep/sleep.csv SHA-256 5563ff4da6cf.
Outputs: two_group_test.csv (6650397b8dea).
Arguments
| path | {data}/student1908-sleep/sleep.csv |
| outcome | extra |
| group | group |
| id_column | ID |
| paired | true |
| test | wilcoxon |
| equal_variance | false |
| alternative | two-sided |
| alpha | 0.05 |
Tool output
{
 "ok": true,
 "summary": "Wilcoxon signed-rank test, two-sided: 2 minus 1 = 1.58, statistic 0, p = 0.003906 (alpha 0.05).",
 "metrics": {
  "n_a": 10,
  "n_b": 10,
  "mean_diff": 1.58,
  "statistic": 0,
  "p_value": 0.00390625,
  "mean_a": 0.75,
  "mean_b": 2.3299999999999996
 },
 "data": {
  "test": "Wilcoxon signed-rank test",
  "alternative": "two-sided",
  "direction": "2 minus 1",
  "alpha": 0.05,
  "significant": true
 },
 "table": {
  "columns": [
   "test",
   "group_a",
   "group_b",
   "n_a",
   "n_b",
   "mean_diff_b_minus_a",
   "statistic",
   "df",
   "p",
   "ci_lo",
   "ci_hi",
   "effect"
  ],
  "rows": [
   [
    "Wilcoxon signed-rank test",
    1,
    2,
    10,
    10,
    1.58,
    0,
    null,
    0.00390625,
    null,
    null,
    null
   ]
  ],
  "n_rows": 1,
  "path": "{work}/compare_two_groups-2/two_group_test.csv"
 }
}
comparison Comparison runs for Test family for two groups. The record keeps the scientist's choice.
Test family for two groups  n_a  n_b  mean_diff  statistic  p_value   mean_a  mean_b  Result
wilcoxon                    10   10   1.58       0          0.003906  0.75    2.33    ok
Result of compare_options: Compared 1 values of Test family for two groups as comparison runs of the last step, compare_two_groups (path={data}/student1908-sleep/sleep.csv, outcome=extra, ...
Compared 1 values of Test family for two groups as comparison runs of the last step, compare_two_groups (path={data}/student1908-sleep/sleep.csv, outcome=extra, group=group, id_column=ID, paired=true, equal_variance=false, alternative=two-sided, alpha=0.05). Only that step was repeated. To compare another step, run it again first. The record still says "t".
Test family for two groups  n_a  n_b  mean_diff  statistic  p_value   mean_a  mean_b  Result
wilcoxon                    10   10   1.58       0          0.003906  0.75    2.33    ok
Model thinking, summary: The Wilcoxon test comes out with p=0.0039, which confirms significance. That settles it.
Model Answer draft 1. The claim check and the review read it.
Yes. Drug 2 gave more extra sleep than drug 1. Drug 2 minus drug 1 is 1.58 hours on average, 95% CI 0.70 to 2.46 hours, p = 0.0028. This is significant at alpha 0.05.
What I did
- I checked the table. It has 20 rows from 10 patients, 2 drug groups and no missing values. Each patient has one value for each drug, so the 10 patients are 10 pairs.
- I compared the extra hours of sleep between the two drugs with a paired t-test. The harness set paired, the t-test, two-sided and alpha 0.05.
- As a check, I ran a paired Wilcoxon signed-rank test. This was a comparison run only. The record still says t-test.
What I found One replicate is one patient. There are 10 patients and each took both drugs.
| Item | Value |
|---|---|
| Mean extra sleep, drug 1 | 0.75 hours |
| Mean extra sleep, drug 2 | 2.33 hours |
| Mean difference (drug 2 minus drug 1) | 1.58 hours |
| 95% confidence interval of the difference | 0.70 to 2.46 hours |
| t statistic | 4.06, with 9 degrees of freedom |
| p-value (two-sided) | 0.0028 |
| Effect size, Cohen's d_z | 1.28 |
| Check: paired Wilcoxon signed-rank test | statistic 0, p = 0.0039 |
Cohen's d_z is the mean difference divided by the standard deviation of the 10 differences. The rank test also falls below alpha 0.05. It tests the center of the differences, not the mean, so it answers a slightly different question.
What I infer On average, patients slept more on drug 2 than on drug 1. The whole confidence interval is above zero.
What is uncertain
- There are only 10 patients, so the interval is wide. The true average gain could be about 0.7 hours or about 2.5 hours.
- The t-test assumes that the differences follow about a normal distribution. 10 values cannot test that well. The rank test, which does not need that assumption, agrees with it.
- The data do not show the order in which each patient took the drugs. I cannot check for an order effect or a carry-over effect.
- The data show the extra hours of sleep only. "Better" here means more extra sleep, not fewer side effects or other outcomes.
What waits for you Nothing waits. The record holds your decisions: paired, t-test, two-sided, alpha 0.05.
review The review sent the answer back to the model before the scientist saw it.
- The answer uses 0.0039 from a comparison run of another option (two_group_test), not from the setting that was chosen. Use the result of the chosen setting, or say clearly that the number is from the comparison.
Fix these problems. Then give the answer again.
Model thinking, summary: I should label the 0.0039 value more clearly as the comparison run rather than just "Check."
Model The model writes its answer. The claim check reads it. See the final answer.
The final answer
The model wrote this answer. The harness shows it to the scientist after the review.
Yes. Drug 2 gave more extra sleep than drug 1. Drug 2 minus drug 1 is 1.58 hours on average, 95% CI 0.70 to 2.46 hours, p = 0.0028. This is significant at alpha 0.05.
What I did
- I checked the table. It has 20 rows from 10 patients, 2 drug groups and no missing values. Each patient has one value for each drug, so the 10 patients are 10 pairs.
- I compared the extra hours of sleep between the two drugs with a paired t-test. The harness set paired, the t-test, two-sided and alpha 0.05.
- As a check, I ran a paired Wilcoxon signed-rank test as a separate comparison run. It did not change your choice, which is still the t-test.
What I found (paired t-test, your chosen setting) One replicate is one patient. There are 10 patients and each took both drugs.
| Item | Value |
|---|---|
| Mean extra sleep, drug 1 | 0.75 hours |
| Mean extra sleep, drug 2 | 2.33 hours |
| Mean difference (drug 2 minus drug 1) | 1.58 hours |
| 95% confidence interval of the difference | 0.70 to 2.46 hours |
| t statistic | 4.06, with 9 degrees of freedom |
| p-value (two-sided) | 0.0028 |
| Effect size, Cohen's d_z | 1.28 |
Cohen's d_z is the mean difference divided by the standard deviation of the 10 differences.
Check only (not the main result) The paired Wilcoxon signed-rank test gave statistic 0 and p = 0.0039. This number comes from the comparison run, not from your chosen test. It also falls below alpha 0.05, so it agrees with the t-test. It tests the center of the differences, not the mean, so it answers a slightly different question.
What I infer On average, patients slept more on drug 2 than on drug 1. The whole confidence interval is above zero.
What is uncertain
- There are only 10 patients, so the interval is wide. The true average gain could be about 0.7 hours or about 2.5 hours.
- The t-test assumes that the differences follow about a normal distribution. 10 values cannot test that well. The rank-test check, which does not need that assumption, agrees with it.
- The data do not show the order in which each patient took the drugs. I cannot check for an order effect or a carry-over effect.
- The data show the extra hours of sleep only. "Better" here means more extra sleep, not fewer side effects or other outcomes.
What waits for you Nothing waits. The record holds your decisions: paired, t-test, two-sided, alpha 0.05.
Settings and step results that the answer does not mention. The harness adds them.
Settings used, from the decision record: Significance level (alpha): 0.05 · Paired test: true · Test family for two groups: t · Assume equal variances (unpaired t-test): false · Sidedness: two-sided.
Values that are not scored
- A trap value is the result of a wrong method, for example an unpaired test on paired data. A trap value in a main step means that the run used the wrong method. A trap value in a comparison run is correct, because the record keeps the scientist's choice.
- An optional value is a second result of the same method. The run can compute it or not.
- A reference value comes from a different program version or a check run by us. We show it for comparison.
| Item | Kind | Known value | Closest logged value | Tolerance | Outcome | Source of the known value |
|---|---|---|---|---|---|---|
welch_p_trapUnpaired Welch p (trap result) | trap | 0.07939 | 0.05n2 compare_two_groups | ± 0.0005 | not in the record | We calculated it with SciPy 1.x ttest_ind with equal_var=False |
Checks
Review findings
The review recorded 3 findings. A rule finding comes from a fixed check in the harness. A referee finding comes from a second model that reads the record. The harness shows the findings to the scientist with the final answer. The record does not mark a finding as fixed. Thus a finding from an early review round can apply to a draft that the model corrected later.
| Severity | From | Finding | Shown with the final answer |
|---|---|---|---|
| error | rulenumber_from_comparison | The answer uses 0.0039 from a comparison run of another option (two_group_test), not from the setting that was chosen. Use the result of the chosen setting, or say clearly that the number is from the comparison. | yes |
| info | referee model | The answer says that the harness set paired, the t-test, two-sided and alpha 0.05. The log shows that the scientist chose these values, so the answer must name the scientist as the source. Later lines of the answer do say "your chosen setting". | yes |
| info | referee model | The sentence "The true average gain could be about 0.7 hours or about 2.5 hours" reads as two possible values. It must say that the 95% CI goes from 0.70 to 2.46 hours. | yes |
Numbers in the answer
The last claim check read 36 numbers in the answer. 36 numbers match a logged result. 0 numbers have no source in the record.
Deviations
The model did not try to change a choice of the scientist.
Failed tool calls
No tool call failed.
Data integrity
Each data file has the same SHA-256 hash now as at the time of the step that read it. Where the download script (fetch.sh) gives a hash, the file also has that hash. The run did not change the data.
| File | SHA-256 | Fetched data | Steps with this hash |
|---|---|---|---|
{data}/student1908-sleep/sleep.csv238 bytes | 5563ff4da6cf | same as the hash in the download script (fetch.sh) | n1, n2, n3 |
A SHA-256 hash is a fingerprint of the file contents. If one byte of the file changes, the hash changes. The table shows the first 12 characters.
How to repeat it
Get the data. The script downloads the files and checks their SHA-256 hashes where it lists them.
CUVETTE_DATA={data} bash bench/papers/student1908-sleep/fetch.shRun the same case with Cuvette. The script gives the same answers from bench/papers/student1908-sleep/bench.yaml.
cuvette bench papers --papers student1908-sleep --models claude:claude-opus-5-5
Repeat each step by hand in the program. For each step, the harness records a manual route: the menu path or the code that gives the same result. This list does not include comparison runs.
inspect_table(step n1)Code
print(pd.read_csv(path).describe(include='all'))path
{data}/student1908-sleep/sleep.csv- Note: The tool also counts distinct values and missing values for each column.
The manual route that the harness recorded
ga_biostats.inspect_table(path="{data}/student1908-sleep/sleep.csv")The manual route uses the same method. The note in the route gives the known difference.
compare_two_groups(step n2)Code
wide = df.pivot(index="ID", columns="group", values="extra") scipy.stats.ttest_1samp(wide[2] - wide[1], 0) # same as ttest_rel(wide[2], wide[1])- values column =
extra - pairing column =
ID - alternative =
two-sided
The manual route that the harness recorded
ga_biostats.compare_two_groups(path="{data}/student1908-sleep/sleep.csv", outcome="extra", group="group", test="t", paired=True, id_column="ID", alternative="two-sided", alpha=0.05, equal_variance=False)The manual route gives the same numbers. An automatic test in Cuvette checks this.
- values column =
Figure
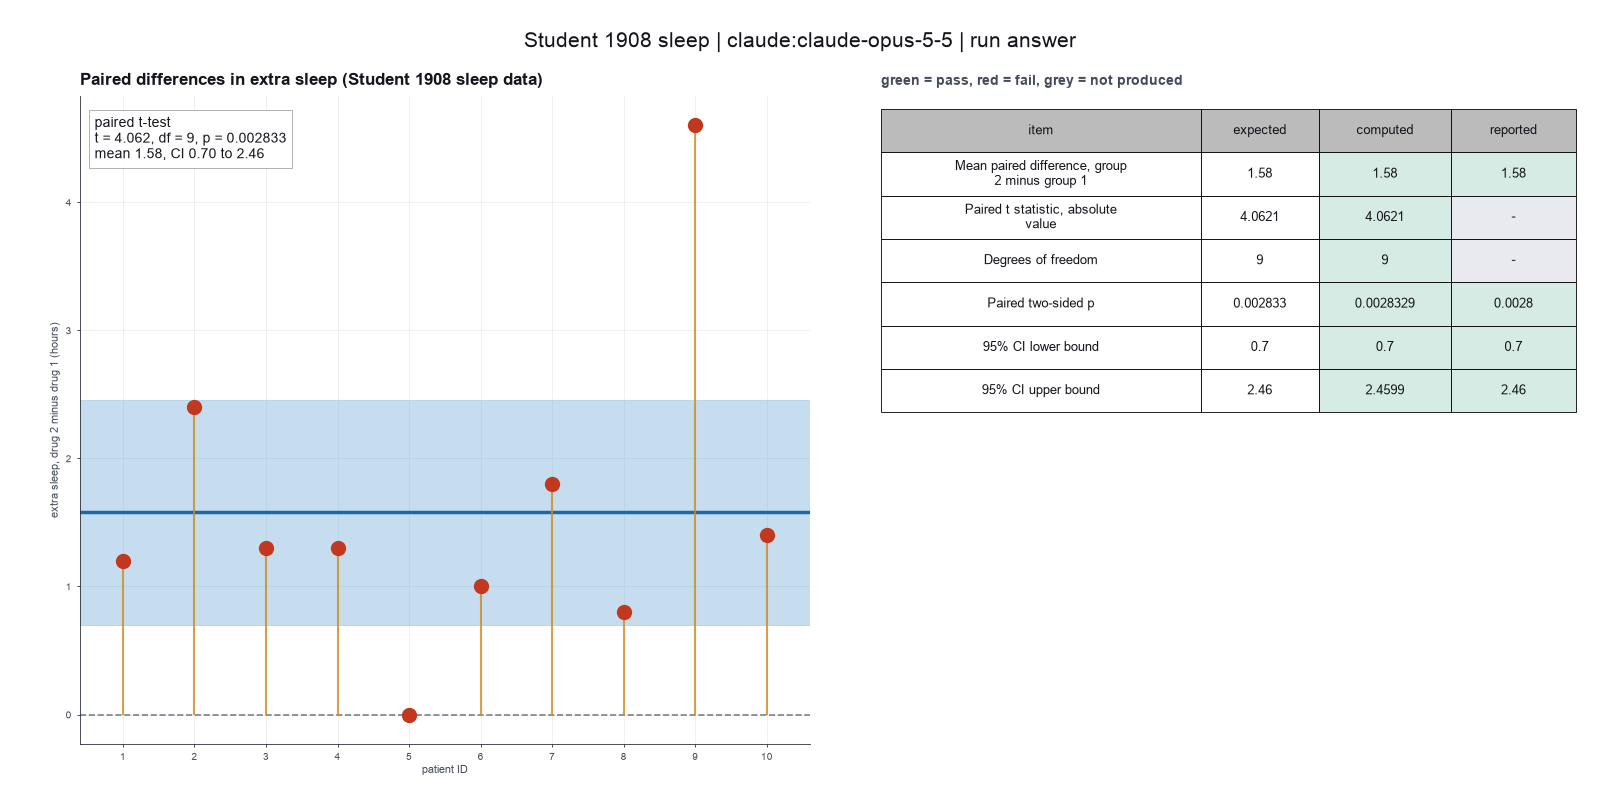
Run facts
| Model | claude-opus-5-5 through the Anthropic service |
| Date | 2026-10-09 12:44:51 UTC |
| End of run | the model gave a final answer |
| Time | 61 s |
| Requests to the model | 6 |
| Tokensunits of text that the model read and wrote | 16 input, 3003 output, 89658 cache read, 20475 cache write |
| Cost estimate | $0.18 at list price, from the token counts |
| Tool calls | 5 (0 failed) |
| Adapters | biostats 0.2.0, program 0.30.3 |
| Session | 20261009-074450-4dd4 |
Code hash of each step (3)
| Step | Tool | Program version | Code hash |
|---|---|---|---|
| n1 | inspect_table | 0.30.3 | 603f546a1fe4 |
| n2 | compare_two_groups | 0.30.3 | c6e869486df4 |
| n3 comparison | compare_two_groups | 0.30.3 | c6e869486df4 |
The code hash is a fingerprint of the adapter name, the adapter version, the tool and its definition in the adapter. If one of these changes, the hash changes.
Sonnet · claude-sonnet-5-5 · run 3 of 3 shown 6 of 6 values match, 4 of 4 correct in the final answer
The session
This is the session as the scientist sees it, in order. Decision cards show the answer that the script gave and where that answer comes from. Each step shows the program, its version, the input file hash and the outputs. Click a line to see more.
setup The decision record starts with these values. A script set them before the first message, from the answers that we wrote before the run.
- Unit of replication: subjects, patients or animals (one value per subject)Where the answer comes from: Illustration I. Each of the ten patients gives one result for each drug.
- Significance level: 0.05Where the answer comes from: Not in the paper. Student gives odds, not a fixed level. We use the usual 0.05.
harness note A note from the harness to the model. The scientist did not write it.
- Setup values:
Design:
- What is the unit of replication? (replicate): subjects, patients or animals (one value per subject)
Inference:
- Significance level (alpha) (alpha): 0.05
Ask the scientist: Paired test (paired), Test family for two groups (two_group_test), Assume equal variances (unpaired t-test) (equal_variance), Sidedness (alternative), ANOVA variance assumption (anova_variance), Pairwise comparisons after ANOVA (posthoc), Correction for a list of p-values (p_adjust_method), Model formula (model_formula), Standard errors for the linear model (standard_errors), Random effects of the mixed model (random_effects), Fit by REML (reml), Covariates of the Cox model (cox_covariates), Ties method of the Cox model (ties), Strata of the Cox model (cox_strata), Type of sums of squares (ss_type), Comparisons of the cell means after a factorial ANOVA (factorial_posthoc), Sphericity correction for repeated measures (sphericity_correction), Correction after a rank test over many groups (rank_p_adjust), Exact or approximate p value for a rank test (exact_p), Covariates of the logistic model (logistic_covariates), Outcome value that counts as the event (logistic_event), Reference level of each categorical covariate (reference_levels), Yates continuity correction for a 2x2 chi-square test (chi_square_correction), Sidedness of the Fisher exact test (fisher_alternative), Method of the McNemar test (mcnemar_method).
The harness fills these values into your tool calls automatically. If you give a different value, the harness logs a deviation and shows it to the scientist.
- Mode is now watch: you run the steps.
inspect_table (adapter biostats).step n1 inspect_table adapter biostats 0.2.0, statsmodels, pingouin, lifelines 0.30.3
20 rows x 4 columns.
Input file: {data}/student1908-sleep/sleep.csv SHA-256 5563ff4da6cf.
Outputs: columns.csv (0b88fe23ba8b).
Arguments
| path | {data}/student1908-sleep/sleep.csv |
Tool output
{
 "ok": true,
 "summary": "20 rows x 4 columns.",
 "metrics": {
  "n_rows": 20,
  "n_columns": 4
 },
 "table": {
  "columns": [
   "column",
   "dtype",
   "n_missing",
   "n_unique",
   "min",
   "max",
   "first_values"
  ],
  "rows": [
   [
    "rownames",
    "int64",
    0,
    20,
    1,
    20,
    "1, 2, 3, 4, 5"
   ],
   [
    "extra",
    "float64",
    0,
    17,
    -1.6,
    5.5,
    "0.7, -1.6, -0.2, -1.2, -0.1"
   ],
   [
    "group",
    "int64",
    0,
    2,
    1,
    2,
    "1, 2"
   ],
   [
    "ID",
    "int64",
    0,
    10,
    1,
    10,
    "1, 2, 3, 4, 5"
   ]
  ],
  "n_rows": 4,
  "path": "{work}/inspect_table-1/columns.csv"
 }
}compare-two-groups.Model
The design is paired (same 10 patients took both drugs). I will run the test; the harness fills in the decisions.
compare_two_groups (adapter biostats).paused The harness paused compare_two_groups until the scientist chose: Paired or unpaired test, Test family for two groups, Equal variances for an unpaired test, Sidedness. The decision cards follow.
decision card Paired test
Use a paired test if the same subject is measured in both groups (before and after, or both drugs in one patient). Use an unpaired test if the groups hold different subjects. The two choices can give different conclusions. The model wants to run compare_two_groups.
Options: yes no
Suggested: true (The model proposed this value when it asked to run the step.)
Answer true
No person answered in this run. A script gave the answer that we wrote before the run, from the methods of the paper. Where the answer comes from: Illustration I. Student makes a new series of differences, drug 2 minus drug 1, for each patient. He notes that the same patient reacts in a similar way to both drugs.
decision card Test family for two groups
t is the t-test. It compares means and gives a confidence interval. wilcoxon is the rank test (signed-rank if paired, Mann-Whitney if unpaired). Use it if the data are far from normal or have outliers. The model wants to run compare_two_groups.
Options: t wilcoxon
Suggested: t (This is the adapter default.)
Answer t
No person answered in this run. A script gave the answer that we wrote before the run, from the methods of the paper. Where the answer comes from: Illustration I. Student uses his own distribution for the mean of a small sample. A rank test is not in the paper.
decision card Assume equal variances (unpaired t-test)
False gives the Welch test. It does not assume equal variances. True gives the Student test. Student's test is correct only if the group variances are equal. The model wants to run compare_two_groups.
Options: yes no
Suggested: false (This is the adapter default.)
Answer false
No person answered in this run. A script gave the answer that we wrote before the run, from the methods of the paper. Where the answer comes from: Not used. A paired test has one series of differences. The value only applies to an unpaired test.
decision card Sidedness
Two-sided tests for a difference in either direction. One-sided tests for one direction only (the second group greater than the first, or less). Choose a one-sided test only if the other direction is not of interest, and decide before you see the data. The model wants to run compare_two_groups.
Options: two-sided greater less
Suggested: two-sided (This is the adapter default.)
Answer two-sided
No person answered in this run. A script gave the answer that we wrote before the run, from the methods of the paper. Where the answer comes from: The modern convention. Student gives the probability that drug 2 is better, which is one direction.
step n2 compare_two_groups adapter biostats 0.2.0, statsmodels, pingouin, lifelines 0.30.3
paired t-test, two-sided: 2 minus 1 = 1.58, statistic 4.062, p = 0.002833 (alpha 0.05).
Decisions applied: Significance level = 0.05; Paired or unpaired test = true; Test family for two groups = t; Equal variances for an unpaired test = false; Sidedness = two-sided.
Input file: {data}/student1908-sleep/sleep.csv SHA-256 5563ff4da6cf.
Outputs: two_group_test.csv (5c80e8fb3427).
Arguments
| path | {data}/student1908-sleep/sleep.csv |
| outcome | extra |
| group | group |
| id_column | ID |
| paired | true |
| test | t |
| equal_variance | false |
| alternative | two-sided |
| alpha | 0.05 |
Tool output
{
 "ok": true,
 "summary": "paired t-test, two-sided: 2 minus 1 = 1.58, statistic 4.062, p = 0.002833 (alpha 0.05).",
 "metrics": {
  "n_a": 10,
  "n_b": 10,
  "mean_diff": 1.58,
  "statistic": 4.062127683382037,
  "df": 9,
  "p_value": 0.0028328901973842724,
  "ci_lo": 0.7001142367230175,
  "ci_hi": 2.459885763276983,
  "effect_size": 1.2845575625910546,
  "mean_a": 0.75,
  "mean_b": 2.3299999999999996
 },
 "data": {
  "test": "paired t-test",
  "alternative": "two-sided",
  "direction": "2 minus 1",
  "alpha": 0.05,
  "significant": true
 },
 "table": {
  "columns": [
   "test",
   "group_a",
   "group_b",
   "n_a",
   "n_b",
   "mean_diff_b_minus_a",
   "statistic",
   "df",
   "p",
   "ci_lo",
   "ci_hi",
   "cohen_dz"
  ],
  "rows": [
   [
    "paired t-test",
    1,
    2,
    10,
    10,
    1.58,
    4.062127683382037,
    9,
    0.0028328901973842724,
    0.7001142367230175,
    2.459885763276983,
    1.2845575625910546
   ]
  ],
  "n_rows": 1,
  "path": "{work}/compare_two_groups-1/two_group_test.csv"
 }
}
Model The model writes its answer. The claim check reads it. See the final answer.
The final answer
The model wrote this answer. The harness shows it to the scientist after the review.
Drug 2 gave more extra sleep than drug 1 in this test.
What I did
- I read the file. It has 20 rows: 10 patients, each with one value for drug 1 and one for drug 2. Nothing is missing.
- Each patient took both drugs, so I used a paired test. The unit of replication is the patient, so n = 10 pairs.
- I ran a paired t-test (two-sided, alpha 0.05) with
compare_two_groups.
What I found (paired t-test, step 3)
- Mean extra sleep was 0.75 hours on drug 1 and 2.33 hours on drug 2.
- The mean difference (drug 2 minus drug 1) is 1.58 hours.
- The 95% confidence interval runs from 0.70 to 2.46 hours.
- The test statistic is t = 4.062 with 9 degrees of freedom, and p = 0.002833.
- The effect size is Cohen's dz = 1.28.
- The p-value is below alpha 0.05, so the difference is significant at that level.
What is uncertain
- The sample is small, with 10 patients, so the confidence interval is wide.
- The t-test assumes the paired differences are roughly normal. I did not run a rank test (Wilcoxon) as a check.
- I ran one test for this question, so I applied no multiple-test correction.
- The data cannot show whether the order of the drugs or other factors affected the result.
What waits for the scientist
- Nothing is blocked. I can run the Wilcoxon signed-rank test as a check if you want it.
Settings and step results that the answer does not mention. The harness adds them.
Settings used, from the decision record: Significance level (alpha): 0.05 · Paired test: true · Test family for two groups: t · Assume equal variances (unpaired t-test): false · Sidedness: two-sided.
Values that are not scored
- A trap value is the result of a wrong method, for example an unpaired test on paired data. A trap value in a main step means that the run used the wrong method. A trap value in a comparison run is correct, because the record keeps the scientist's choice.
- An optional value is a second result of the same method. The run can compute it or not.
- A reference value comes from a different program version or a check run by us. We show it for comparison.
| Item | Kind | Known value | Closest logged value | Tolerance | Outcome | Source of the known value |
|---|---|---|---|---|---|---|
welch_p_trapUnpaired Welch p (trap result) | trap | 0.07939 | 0.05n2 compare_two_groups | ± 0.0005 | not in the record | We calculated it with SciPy 1.x ttest_ind with equal_var=False |
Checks
Review findings
The review recorded 1 finding. A rule finding comes from a fixed check in the harness. A referee finding comes from a second model that reads the record. The harness shows the findings to the scientist with the final answer. The record does not mark a finding as fixed. Thus a finding from an early review round can apply to a draft that the model corrected later.
| Severity | From | Finding | Shown with the final answer |
|---|---|---|---|
| info | ruletext_style | The answer breaks the text rules (ASD-STE100) in 1 place. Sentence 23 uses the passive voice: "is blocked". Use the active voice. | yes |
Numbers in the answer
The last claim check read 21 numbers in the answer. 21 numbers match a logged result. 0 numbers have no source in the record.
Deviations
The model did not try to change a choice of the scientist.
Failed tool calls
No tool call failed.
Data integrity
Each data file has the same SHA-256 hash now as at the time of the step that read it. Where the download script (fetch.sh) gives a hash, the file also has that hash. The run did not change the data.
| File | SHA-256 | Fetched data | Steps with this hash |
|---|---|---|---|
{data}/student1908-sleep/sleep.csv238 bytes | 5563ff4da6cf | same as the hash in the download script (fetch.sh) | n1, n2 |
A SHA-256 hash is a fingerprint of the file contents. If one byte of the file changes, the hash changes. The table shows the first 12 characters.
How to repeat it
Get the data. The script downloads the files and checks their SHA-256 hashes where it lists them.
CUVETTE_DATA={data} bash bench/papers/student1908-sleep/fetch.shRun the same case with Cuvette. The script gives the same answers from bench/papers/student1908-sleep/bench.yaml.
cuvette bench papers --papers student1908-sleep --models claude:claude-sonnet-5-5
Repeat each step by hand in the program. For each step, the harness records a manual route: the menu path or the code that gives the same result. This list does not include comparison runs.
inspect_table(step n1)Code
print(pd.read_csv(path).describe(include='all'))path
{data}/student1908-sleep/sleep.csv- Note: The tool also counts distinct values and missing values for each column.
The manual route that the harness recorded
ga_biostats.inspect_table(path="{data}/student1908-sleep/sleep.csv")The manual route uses the same method. The note in the route gives the known difference.
compare_two_groups(step n2)Code
wide = df.pivot(index="ID", columns="group", values="extra") scipy.stats.ttest_1samp(wide[2] - wide[1], 0) # same as ttest_rel(wide[2], wide[1])- values column =
extra - pairing column =
ID - alternative =
two-sided
The manual route that the harness recorded
ga_biostats.compare_two_groups(path="{data}/student1908-sleep/sleep.csv", outcome="extra", group="group", test="t", paired=True, id_column="ID", alternative="two-sided", alpha=0.05, equal_variance=False)The manual route gives the same numbers. An automatic test in Cuvette checks this.
- values column =
Figure
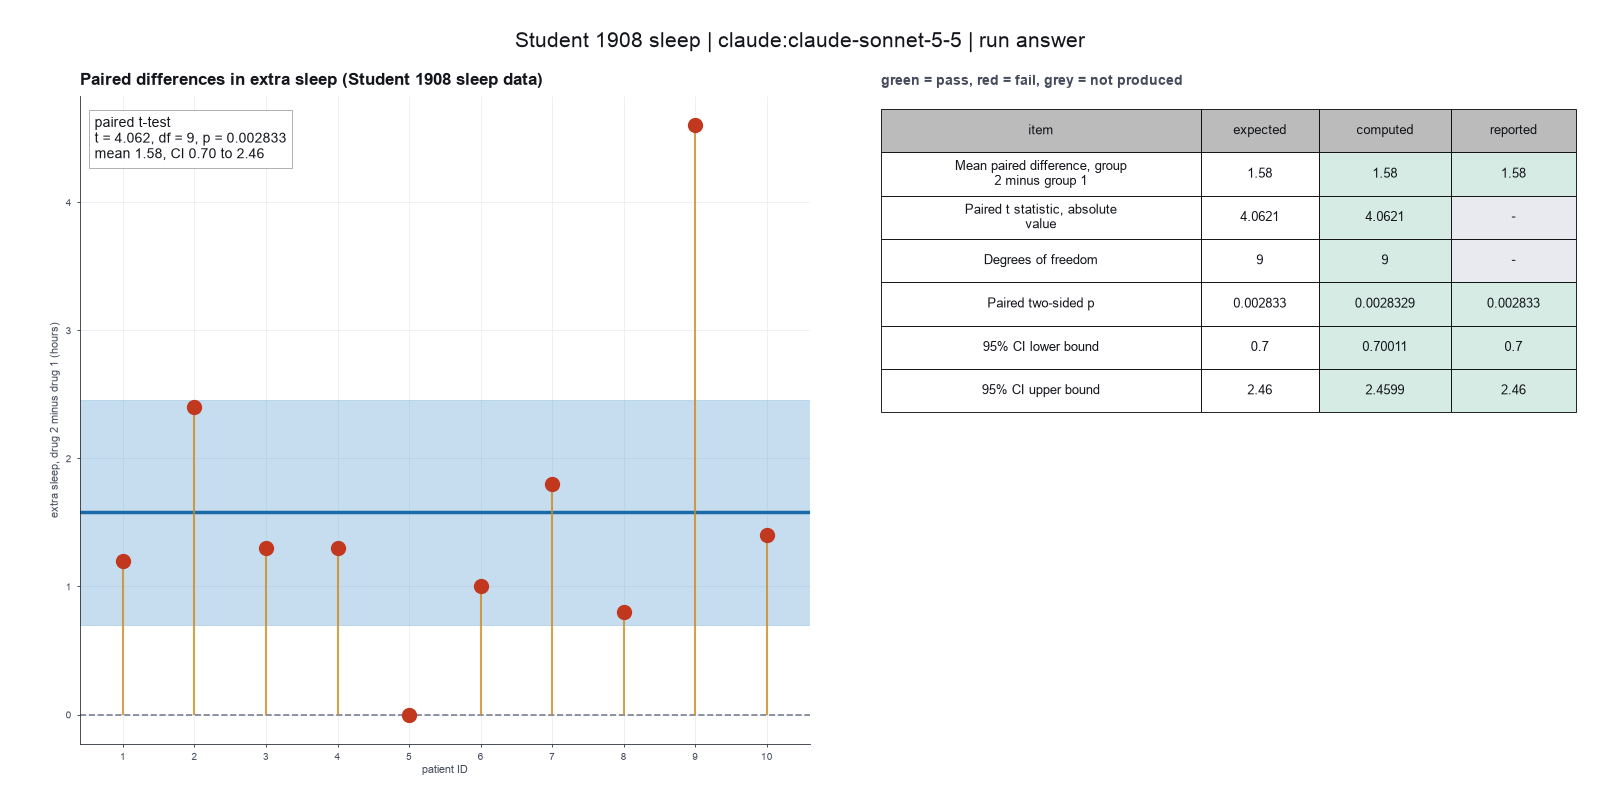
Run facts
| Model | claude-sonnet-5-5 through the Anthropic service |
| Date | 2026-10-09 11:11:24 UTC |
| End of run | the model gave a final answer |
| Time | 15 s |
| Requests to the model | 3 |
| Tokensunits of text that the model read and wrote | 8 input, 868 output, 33504 cache read, 18294 cache write |
| Cost estimate | $0.06 at list price, from the token counts |
| Tool calls | 3 (0 failed) |
| Adapters | biostats 0.2.0, program 0.30.3 |
| Session | 20261009-061123-cc04 |
Code hash of each step (2)
| Step | Tool | Program version | Code hash |
|---|---|---|---|
| n1 | inspect_table | 0.30.3 | 603f546a1fe4 |
| n2 | compare_two_groups | 0.30.3 | c6e869486df4 |
The code hash is a fingerprint of the adapter name, the adapter version, the tool and its definition in the adapter. If one of these changes, the hash changes.
Haiku · claude-haiku-5-5 · run 3 of 3 shown 6 of 6 values match, 4 of 4 correct in the final answer
The session
This is the session as the scientist sees it, in order. Decision cards show the answer that the script gave and where that answer comes from. Each step shows the program, its version, the input file hash and the outputs. Click a line to see more.
setup The decision record starts with these values. A script set them before the first message, from the answers that we wrote before the run.
- Unit of replication: subjects, patients or animals (one value per subject)Where the answer comes from: Illustration I. Each of the ten patients gives one result for each drug.
- Significance level: 0.05Where the answer comes from: Not in the paper. Student gives odds, not a fixed level. We use the usual 0.05.
harness note A note from the harness to the model. The scientist did not write it.
- Setup values:
Design:
- What is the unit of replication? (replicate): subjects, patients or animals (one value per subject)
Inference:
- Significance level (alpha) (alpha): 0.05
Ask the scientist: Paired test (paired), Test family for two groups (two_group_test), Assume equal variances (unpaired t-test) (equal_variance), Sidedness (alternative), ANOVA variance assumption (anova_variance), Pairwise comparisons after ANOVA (posthoc), Correction for a list of p-values (p_adjust_method), Model formula (model_formula), Standard errors for the linear model (standard_errors), Random effects of the mixed model (random_effects), Fit by REML (reml), Covariates of the Cox model (cox_covariates), Ties method of the Cox model (ties), Strata of the Cox model (cox_strata), Type of sums of squares (ss_type), Comparisons of the cell means after a factorial ANOVA (factorial_posthoc), Sphericity correction for repeated measures (sphericity_correction), Correction after a rank test over many groups (rank_p_adjust), Exact or approximate p value for a rank test (exact_p), Covariates of the logistic model (logistic_covariates), Outcome value that counts as the event (logistic_event), Reference level of each categorical covariate (reference_levels), Yates continuity correction for a 2x2 chi-square test (chi_square_correction), Sidedness of the Fisher exact test (fisher_alternative), Method of the McNemar test (mcnemar_method).
The harness fills these values into your tool calls automatically. If you give a different value, the harness logs a deviation and shows it to the scientist.
- Mode is now watch: you run the steps.
Model thinking, summary: Let me inspect the table first. This looks like paired sleep data for 10 patients across two drugs, so I'll want to run a paired comparison between the two groups using the ID column to match them up.
Model
I will start by checking the columns and missing values in the sleep file.
inspect_table (adapter biostats).step n1 inspect_table adapter biostats 0.2.0, statsmodels, pingouin, lifelines 0.30.3
20 rows x 4 columns.
Input file: {data}/student1908-sleep/sleep.csv SHA-256 5563ff4da6cf.
Outputs: columns.csv (0b88fe23ba8b).
Arguments
| path | {data}/student1908-sleep/sleep.csv |
Tool output
{
 "ok": true,
 "summary": "20 rows x 4 columns.",
 "metrics": {
  "n_rows": 20,
  "n_columns": 4
 },
 "table": {
  "columns": [
   "column",
   "dtype",
   "n_missing",
   "n_unique",
   "min",
   "max",
   "first_values"
  ],
  "rows": [
   [
    "rownames",
    "int64",
    0,
    20,
    1,
    20,
    "1, 2, 3, 4, 5"
   ],
   [
    "extra",
    "float64",
    0,
    17,
    -1.6,
    5.5,
    "0.7, -1.6, -0.2, -1.2, -0.1"
   ],
   [
    "group",
    "int64",
    0,
    2,
    1,
    2,
    "1, 2"
   ],
   [
    "ID",
    "int64",
    0,
    10,
    1,
    10,
    "1, 2, 3, 4, 5"
   ]
  ],
  "n_rows": 4,
  "path": "{work}/inspect_table-1/columns.csv"
 }
}
Model thinking, summary: There's a conflict in the data: the harness check reports 4 rows and 7 columns, but I expected 20 rows by 4 columns. I need to check the columns file directly to resolve this discrepancy.
Model
The inspection result and the harness data check disagree on the table size. I will read the column summary to check.
read_file.Result of read_file: Read 226 of 226 bytes from {work}/inspect_table-1/columns.csv.
column,dtype,n_missing,n_unique,min,max,first_values
rownames,int64,0,20,1.0,20.0,"1, 2, 3, 4, 5"
extra,float64,0,17,-1.6,5.5,"0.7, -1.6, -0.2, -1.2, -0.1"
group,int64,0,2,1.0,2.0,"1, 2"
ID,int64,0,10,1.0,10.0,"1, 2, 3, 4, 5"
read_file.Result of read_file: Read 238 of 238 bytes from {data}/student1908-sleep/sleep.csv.
rownames,extra,group,ID
1,0.7,1,1
2,-1.6,1,2
3,-0.2,1,3
4,-1.2,1,4
5,-0.1,1,5
6,3.4,1,6
7,3.7,1,7
8,0.8,1,8
9,0,1,9
10,2,1,10
11,1.9,2,1
12,0.8,2,2
13,1.1,2,3
14,0.1,2,4
15,-0.1,2,5
16,4.4,2,6
17,5.5,2,7
18,1.6,2,8
19,4.6,2,9
20,3.4,2,10
Model thinking, summary: The data has 20 rows with two drug groups and repeated IDs, so this calls for a paired test matched on ID — I'll run a paired t-test comparing group 2 minus group 1, using a two-sided alpha of 0.05.
Model
The file holds 20 rows and 4 columns: extra sleep, drug group (1 or 2), patient ID and row name. Each of the 10 patients appears once in each group, so I will run a paired t-test on the patient ID.
compare_two_groups (adapter biostats).paused The harness paused compare_two_groups until the scientist chose: Paired or unpaired test, Test family for two groups, Equal variances for an unpaired test, Sidedness. The decision cards follow.
decision card Paired test
Use a paired test if the same subject is measured in both groups (before and after, or both drugs in one patient). Use an unpaired test if the groups hold different subjects. The two choices can give different conclusions. The model wants to run compare_two_groups.
Options: yes no
Suggested: true (The model proposed this value when it asked to run the step.)
Answer true
No person answered in this run. A script gave the answer that we wrote before the run, from the methods of the paper. Where the answer comes from: Illustration I. Student makes a new series of differences, drug 2 minus drug 1, for each patient. He notes that the same patient reacts in a similar way to both drugs.
decision card Test family for two groups
t is the t-test. It compares means and gives a confidence interval. wilcoxon is the rank test (signed-rank if paired, Mann-Whitney if unpaired). Use it if the data are far from normal or have outliers. The model wants to run compare_two_groups.
Options: t wilcoxon
Suggested: t (The model proposed this value when it asked to run the step.)
Answer t
No person answered in this run. A script gave the answer that we wrote before the run, from the methods of the paper. Where the answer comes from: Illustration I. Student uses his own distribution for the mean of a small sample. A rank test is not in the paper.
decision card Assume equal variances (unpaired t-test)
False gives the Welch test. It does not assume equal variances. True gives the Student test. Student's test is correct only if the group variances are equal. The model wants to run compare_two_groups.
Options: yes no
Suggested: false (This is the adapter default.)
Answer false
No person answered in this run. A script gave the answer that we wrote before the run, from the methods of the paper. Where the answer comes from: Not used. A paired test has one series of differences. The value only applies to an unpaired test.
decision card Sidedness
Two-sided tests for a difference in either direction. One-sided tests for one direction only (the second group greater than the first, or less). Choose a one-sided test only if the other direction is not of interest, and decide before you see the data. The model wants to run compare_two_groups.
Options: two-sided greater less
Suggested: two-sided (This is the adapter default.)
Answer two-sided
No person answered in this run. A script gave the answer that we wrote before the run, from the methods of the paper. Where the answer comes from: The modern convention. Student gives the probability that drug 2 is better, which is one direction.
step n2 compare_two_groups adapter biostats 0.2.0, statsmodels, pingouin, lifelines 0.30.3
paired t-test, two-sided: 2 minus 1 = 1.58, statistic 4.062, p = 0.002833 (alpha 0.05).
Decisions applied: Significance level = 0.05; Paired or unpaired test = true; Test family for two groups = t; Equal variances for an unpaired test = false; Sidedness = two-sided.
Input file: {data}/student1908-sleep/sleep.csv SHA-256 5563ff4da6cf.
Outputs: two_group_test.csv (5c80e8fb3427).
Arguments
| path | {data}/student1908-sleep/sleep.csv |
| outcome | extra |
| group | group |
| paired | true |
| id_column | ID |
| test | t |
| alpha | 0.05 |
| equal_variance | false |
| alternative | two-sided |
Tool output
{
 "ok": true,
 "summary": "paired t-test, two-sided: 2 minus 1 = 1.58, statistic 4.062, p = 0.002833 (alpha 0.05).",
 "metrics": {
  "n_a": 10,
  "n_b": 10,
  "mean_diff": 1.58,
  "statistic": 4.062127683382037,
  "df": 9,
  "p_value": 0.0028328901973842724,
  "ci_lo": 0.7001142367230175,
  "ci_hi": 2.459885763276983,
  "effect_size": 1.2845575625910546,
  "mean_a": 0.75,
  "mean_b": 2.3299999999999996
 },
 "data": {
  "test": "paired t-test",
  "alternative": "two-sided",
  "direction": "2 minus 1",
  "alpha": 0.05,
  "significant": true
 },
 "table": {
  "columns": [
   "test",
   "group_a",
   "group_b",
   "n_a",
   "n_b",
   "mean_diff_b_minus_a",
   "statistic",
   "df",
   "p",
   "ci_lo",
   "ci_hi",
   "cohen_dz"
  ],
  "rows": [
   [
    "paired t-test",
    1,
    2,
    10,
    10,
    1.58,
    4.062127683382037,
    9,
    0.0028328901973842724,
    0.7001142367230175,
    2.459885763276983,
    1.2845575625910546
   ]
  ],
  "n_rows": 1,
  "path": "{work}/compare_two_groups-1/two_group_test.csv"
 }
}
Model Answer draft 1. The claim check and the review read it.
Result: drug 2 gives more extra sleep than drug 1 in the same patients (paired t-test, p = 0.0028).
What I did
- I checked the file. It holds 20 rows and 4 columns: extra sleep, drug group (1 or 2), patient ID and a row name. No values are missing. Each of the 10 patients (ID 1 to 10) appears once with each drug.
- I ran a paired t-test on the extra sleep. The test pairs the two rows of each patient by ID. The test is two-sided, with alpha = 0.05. The tool gives the difference as drug 2 minus drug 1.
Results (n = 10 patients, 20 rows)
- Mean extra sleep, drug 1: 0.75 hours.
- Mean extra sleep, drug 2: 2.33 hours.
- Mean difference (drug 2 minus drug 1): 1.58 hours.
- 95% confidence interval for the mean difference: 0.70 to 2.46 hours.
- t = 4.062, df = 9, p = 0.0028. This is significant at alpha 0.05.
- Effect size (Cohen's dz, paired): 1.28.
What this means
- The data show a larger average gain in sleep with drug 2 than with drug 1.
- The paired test uses the patient as the unit of replication, so n = 10 patients.
- The test measures only extra sleep hours. It does not show side effects or other reasons to choose one drug.
Uncertain
- The sample is small (10 patients). The interval is wide.
- The t-test assumes the differences are roughly normal. I did not run a rank test to check this.
- The harness data check reported 4 rows and 7 columns. This does not match the file. My reading of the file shows 20 rows and 4 columns, and the analysis used those rows.
Waiting for you
- Nothing waits. If you want a rank test instead, or a one-sided test, tell me before I run it. The sidedness and test family are your decisions.
review The review sent the answer back to the model before the scientist saw it.
- The answer says the harness data check reported 4 rows and 7 columns. The log shows inspect_table reported 20 rows and 4 columns. The 4 rows and 7 columns figure has no source in the log and must be removed.
Fix these problems. Then give the answer again.
Model The model writes its answer. The claim check reads it. See the final answer.
The final answer
The model wrote this answer. The harness shows it to the scientist after the review.
Result: drug 2 gives more extra sleep than drug 1 in the same patients (paired t-test, p = 0.0028).
What I did
- I checked the file with the column summary and the raw rows. The file holds 20 rows and 4 columns: extra sleep, drug group (1 or 2), patient ID and a row name. No values are missing. Each of the 10 patients (ID 1 to 10) appears once with each drug.
- I ran a paired t-test on the extra sleep. The test pairs the two rows of each patient by ID. The test is two-sided, with alpha = 0.05. The tool gives the difference as drug 2 minus drug 1.
Results (n = 10 patients, 20 rows)
- Mean extra sleep, drug 1: 0.75 hours.
- Mean extra sleep, drug 2: 2.33 hours.
- Mean difference (drug 2 minus drug 1): 1.58 hours.
- 95% confidence interval for the mean difference: 0.70 to 2.46 hours.
- t = 4.062, df = 9, p = 0.0028. This is significant at alpha 0.05.
- Effect size (Cohen's dz, paired): 1.28.
What this means
- The data show a larger average gain in sleep with drug 2 than with drug 1.
- The paired test uses the patient as the unit of replication, so n = 10 patients.
- The test measures only extra sleep hours. It does not show side effects or other reasons to choose one drug.
Uncertain
- The sample is small (10 patients). The interval is wide.
- The t-test assumes the differences are roughly normal. I did not run a rank test to check this.
Waiting for you
- Nothing waits. If you want a rank test instead, or a one-sided test, tell me before I run it. The sidedness and test family are your decisions.
Settings and step results that the answer does not mention. The harness adds them.
Settings used, from the decision record: Significance level (alpha): 0.05 · Paired test: true · Test family for two groups: t · Assume equal variances (unpaired t-test): false · Sidedness: two-sided.
Values that are not scored
- A trap value is the result of a wrong method, for example an unpaired test on paired data. A trap value in a main step means that the run used the wrong method. A trap value in a comparison run is correct, because the record keeps the scientist's choice.
- An optional value is a second result of the same method. The run can compute it or not.
- A reference value comes from a different program version or a check run by us. We show it for comparison.
| Item | Kind | Known value | Closest logged value | Tolerance | Outcome | Source of the known value |
|---|---|---|---|---|---|---|
welch_p_trapUnpaired Welch p (trap result) | trap | 0.07939 | 0.05n2 compare_two_groups | ± 0.0005 | not in the record | We calculated it with SciPy 1.x ttest_ind with equal_var=False |
Checks
Review findings
The review recorded 1 finding. A rule finding comes from a fixed check in the harness. A referee finding comes from a second model that reads the record. The harness shows the findings to the scientist with the final answer. The record does not mark a finding as fixed. Thus a finding from an early review round can apply to a draft that the model corrected later.
| Severity | From | Finding | Shown with the final answer |
|---|---|---|---|
| info | referee model | The answer says each patient appears once with each drug. The inspection log shows only 10 unique IDs in 20 rows. The paired test used n = 10 per group, which supports this, but no step printed the ID-by-group layout directly. | yes |
Numbers in the answer
The last claim check read 31 numbers in the answer. 31 numbers match a logged result. 0 numbers have no source in the record.
Deviations
The model did not try to change a choice of the scientist.
Failed tool calls
No tool call failed.
Data integrity
Each data file has the same SHA-256 hash now as at the time of the step that read it. Where the download script (fetch.sh) gives a hash, the file also has that hash. The run did not change the data.
| File | SHA-256 | Fetched data | Steps with this hash |
|---|---|---|---|
{data}/student1908-sleep/sleep.csv238 bytes | 5563ff4da6cf | same as the hash in the download script (fetch.sh) | n1, n2 |
A SHA-256 hash is a fingerprint of the file contents. If one byte of the file changes, the hash changes. The table shows the first 12 characters.
How to repeat it
Get the data. The script downloads the files and checks their SHA-256 hashes where it lists them.
CUVETTE_DATA={data} bash bench/papers/student1908-sleep/fetch.shRun the same case with Cuvette. The script gives the same answers from bench/papers/student1908-sleep/bench.yaml.
cuvette bench papers --papers student1908-sleep --models claude:claude-haiku-5-5
Repeat each step by hand in the program. For each step, the harness records a manual route: the menu path or the code that gives the same result. This list does not include comparison runs.
inspect_table(step n1)Code
print(pd.read_csv(path).describe(include='all'))path
{data}/student1908-sleep/sleep.csv- Note: The tool also counts distinct values and missing values for each column.
The manual route that the harness recorded
ga_biostats.inspect_table(path="{data}/student1908-sleep/sleep.csv")The manual route uses the same method. The note in the route gives the known difference.
compare_two_groups(step n2)Code
wide = df.pivot(index="ID", columns="group", values="extra") scipy.stats.ttest_1samp(wide[2] - wide[1], 0) # same as ttest_rel(wide[2], wide[1])- values column =
extra - pairing column =
ID - alternative =
two-sided
The manual route that the harness recorded
ga_biostats.compare_two_groups(path="{data}/student1908-sleep/sleep.csv", outcome="extra", group="group", test="t", paired=True, id_column="ID", alternative="two-sided", alpha=0.05, equal_variance=False)The manual route gives the same numbers. An automatic test in Cuvette checks this.
- values column =
Figure
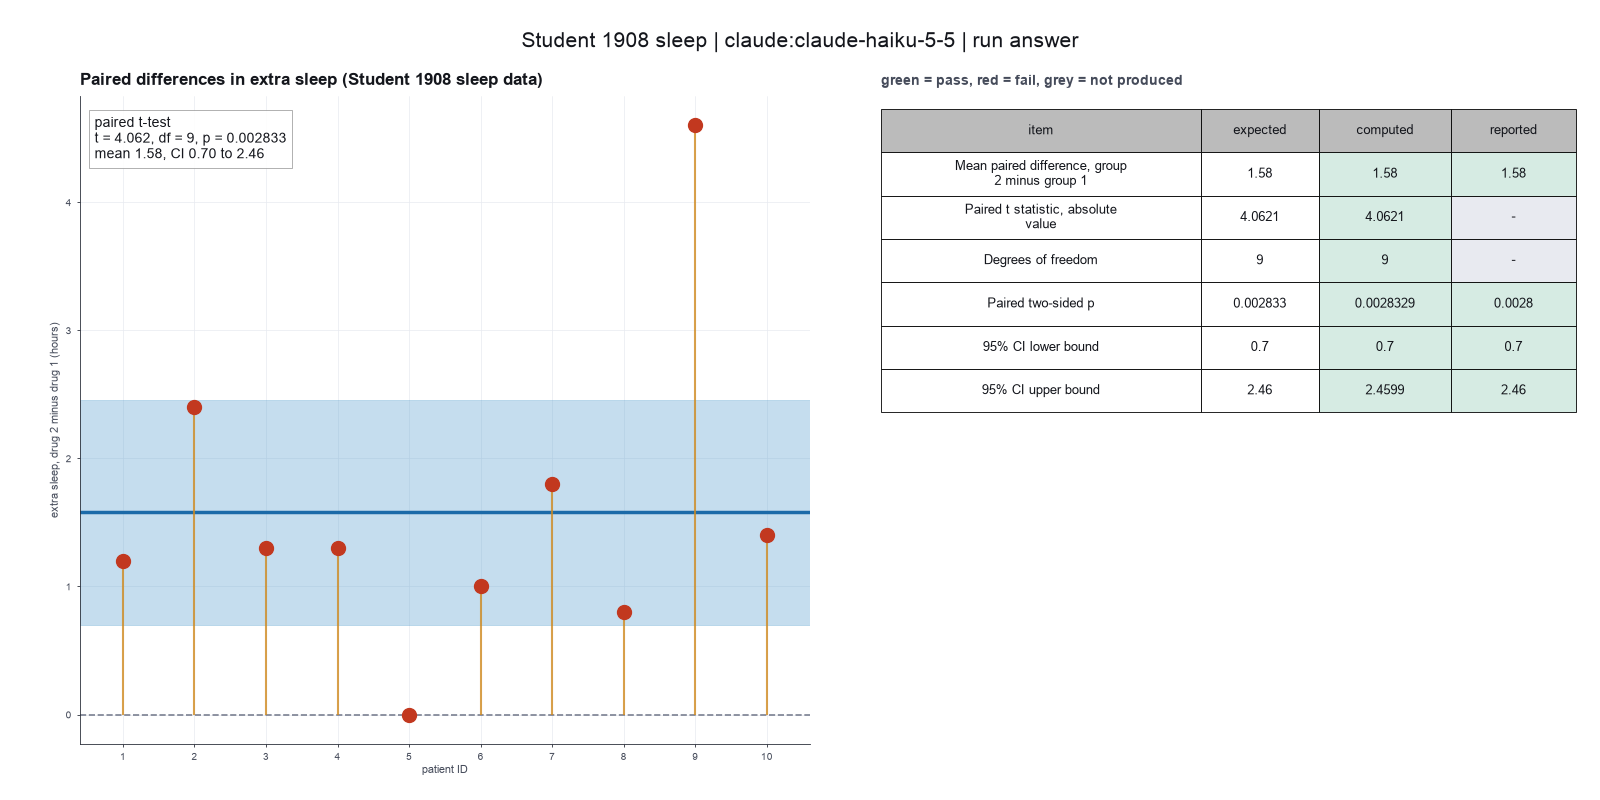
Run facts
| Model | claude-haiku-5-5 through the Anthropic service |
| Date | 2026-10-09 12:54:22 UTC |
| End of run | the model gave a final answer |
| Time | 45 s |
| Requests to the model | 5 |
| Tokensunits of text that the model read and wrote | 14 input, 3591 output, 69589 cache read, 20176 cache write |
| Cost estimate | $0.01 at list price, from the token counts |
| Tool calls | 4 (0 failed) |
| Adapters | biostats 0.2.0, program 0.30.3 |
| Session | 20261009-075422-209d |
Code hash of each step (2)
| Step | Tool | Program version | Code hash |
|---|---|---|---|
| n1 | inspect_table | 0.30.3 | 603f546a1fe4 |
| n2 | compare_two_groups | 0.30.3 | c6e869486df4 |
The code hash is a fingerprint of the adapter name, the adapter version, the tool and its definition in the adapter. If one of these changes, the hash changes.
qwen3:8b · local model through Ollama 6 of 6 values match, 4 of 4 correct in the final answer
The session
This is the session as the scientist sees it, in order. Decision cards show the answer that the script gave and where that answer comes from. Each step shows the program, its version, the input file hash and the outputs. Click a line to see more.
setup The decision record starts with these values. A script set them before the first message, from the answers that we wrote before the run.
- Unit of replication: subjects, patients or animals (one value per subject)Where the answer comes from: Illustration I. Each of the ten patients gives one result for each drug.
- Significance level: 0.05Where the answer comes from: Not in the paper. Student gives odds, not a fixed level. We use the usual 0.05.
harness note A note from the harness to the model. The scientist did not write it.
- Setup values:
Design:
- What is the unit of replication? (replicate): subjects, patients or animals (one value per subject)
Inference:
- Significance level (alpha) (alpha): 0.05
Ask the scientist: Paired test (paired), Test family for two groups (two_group_test), Assume equal variances (unpaired t-test) (equal_variance), Sidedness (alternative), ANOVA variance assumption (anova_variance), Pairwise comparisons after ANOVA (posthoc), Correction for a list of p-values (p_adjust_method), Model formula (model_formula), Standard errors for the linear model (standard_errors), Random effects of the mixed model (random_effects), Fit by REML (reml), Covariates of the Cox model (cox_covariates), Ties method of the Cox model (ties), Strata of the Cox model (cox_strata), Type of sums of squares (ss_type), Comparisons of the cell means after a factorial ANOVA (factorial_posthoc), Sphericity correction for repeated measures (sphericity_correction), Correction after a rank test over many groups (rank_p_adjust), Exact or approximate p value for a rank test (exact_p), Covariates of the logistic model (logistic_covariates), Outcome value that counts as the event (logistic_event), Reference level of each categorical covariate (reference_levels), Yates continuity correction for a 2x2 chi-square test (chi_square_correction), Sidedness of the Fisher exact test (fisher_alternative), Method of the McNemar test (mcnemar_method).
The harness fills these values into your tool calls automatically. If you give a different value, the harness logs a deviation and shows it to the scientist.
- Mode is now watch: you run the steps.
inspect_table (adapter biostats).step n1 inspect_table adapter biostats 0.2.0, statsmodels, pingouin, lifelines 0.30.3
20 rows x 4 columns.
Input file: {data}/student1908-sleep/sleep.csv SHA-256 5563ff4da6cf.
Outputs: columns.csv (0b88fe23ba8b).
Arguments
| path | {data}/student1908-sleep/sleep.csv |
Tool output
{
 "ok": true,
 "summary": "20 rows x 4 columns.",
 "metrics": {
  "n_rows": 20,
  "n_columns": 4
 },
 "table": {
  "columns": [
   "column",
   "dtype",
   "n_missing",
   "n_unique",
   "min",
   "max",
   "first_values"
  ],
  "rows": [
   [
    "rownames",
    "int64",
    0,
    20,
    1,
    20,
    "1, 2, 3, 4, 5"
   ],
   [
    "extra",
    "float64",
    0,
    17,
    -1.6,
    5.5,
    "0.7, -1.6, -0.2, -1.2, -0.1"
   ],
   [
    "group",
    "int64",
    0,
    2,
    1,
    2,
    "1, 2"
   ],
   [
    "ID",
    "int64",
    0,
    10,
    1,
    10,
    "1, 2, 3, 4, 5"
   ]
  ],
  "n_rows": 4,
  "path": "{work}/inspect_table-1/columns.csv"
 }
}compare_two_groups (adapter biostats).paused The harness paused compare_two_groups until the scientist chose: Paired or unpaired test, Test family for two groups, Equal variances for an unpaired test, Sidedness. The decision cards follow.
decision card Paired test
Use a paired test if the same subject is measured in both groups (before and after, or both drugs in one patient). Use an unpaired test if the groups hold different subjects. The two choices can give different conclusions. The model wants to run compare_two_groups.
Options: yes no
Suggested: true (The model proposed this value when it asked to run the step.)
Answer true
No person answered in this run. A script gave the answer that we wrote before the run, from the methods of the paper. Where the answer comes from: Illustration I. Student makes a new series of differences, drug 2 minus drug 1, for each patient. He notes that the same patient reacts in a similar way to both drugs.
decision card Test family for two groups
t is the t-test. It compares means and gives a confidence interval. wilcoxon is the rank test (signed-rank if paired, Mann-Whitney if unpaired). Use it if the data are far from normal or have outliers. The model wants to run compare_two_groups.
Options: t wilcoxon
Suggested: t (The model proposed this value when it asked to run the step.)
Answer t
No person answered in this run. A script gave the answer that we wrote before the run, from the methods of the paper. Where the answer comes from: Illustration I. Student uses his own distribution for the mean of a small sample. A rank test is not in the paper.
decision card Assume equal variances (unpaired t-test)
False gives the Welch test. It does not assume equal variances. True gives the Student test. Student's test is correct only if the group variances are equal. The model wants to run compare_two_groups.
Options: yes no
Suggested: true (The model proposed this value when it asked to run the step.)
Answer false
No person answered in this run. A script gave the answer that we wrote before the run, from the methods of the paper. Where the answer comes from: Not used. A paired test has one series of differences. The value only applies to an unpaired test.
decision card Sidedness
Two-sided tests for a difference in either direction. One-sided tests for one direction only (the second group greater than the first, or less). Choose a one-sided test only if the other direction is not of interest, and decide before you see the data. The model wants to run compare_two_groups.
Options: two-sided greater less
Suggested: two-sided (The model proposed this value when it asked to run the step.)
Answer two-sided
No person answered in this run. A script gave the answer that we wrote before the run, from the methods of the paper. Where the answer comes from: The modern convention. Student gives the probability that drug 2 is better, which is one direction.
step n2 compare_two_groups adapter biostats 0.2.0, statsmodels, pingouin, lifelines 0.30.3
paired t-test, two-sided: 2 minus 1 = 1.58, statistic 4.062, p = 0.002833 (alpha 0.05).
Decisions applied: Significance level = 0.05; Paired or unpaired test = true; Test family for two groups = t; Equal variances for an unpaired test = false; Sidedness = two-sided.
Input file: {data}/student1908-sleep/sleep.csv SHA-256 5563ff4da6cf.
Outputs: two_group_test.csv (5c80e8fb3427).
Arguments
| group | group |
| id_column | ID |
| outcome | extra |
| path | {data}/student1908-sleep/sleep.csv |
| test | t |
| equal_variance | false |
| paired | true |
| alpha | 0.05 |
| alternative | two-sided |
Tool output
{
 "ok": true,
 "summary": "paired t-test, two-sided: 2 minus 1 = 1.58, statistic 4.062, p = 0.002833 (alpha 0.05).",
 "metrics": {
  "n_a": 10,
  "n_b": 10,
  "mean_diff": 1.58,
  "statistic": 4.062127683382037,
  "df": 9,
  "p_value": 0.0028328901973842724,
  "ci_lo": 0.7001142367230175,
  "ci_hi": 2.459885763276983,
  "effect_size": 1.2845575625910546,
  "mean_a": 0.75,
  "mean_b": 2.3299999999999996
 },
 "data": {
  "test": "paired t-test",
  "alternative": "two-sided",
  "direction": "2 minus 1",
  "alpha": 0.05,
  "significant": true
 },
 "table": {
  "columns": [
   "test",
   "group_a",
   "group_b",
   "n_a",
   "n_b",
   "mean_diff_b_minus_a",
   "statistic",
   "df",
   "p",
   "ci_lo",
   "ci_hi",
   "cohen_dz"
  ],
  "rows": [
   [
    "paired t-test",
    1,
    2,
    10,
    10,
    1.58,
    4.062127683382037,
    9,
    0.0028328901973842724,
    0.7001142367230175,
    2.459885763276983,
    1.2845575625910546
   ]
  ],
  "n_rows": 1,
  "path": "{work}/compare_two_groups-1/two_group_test.csv"
 }
}
Model The model writes its answer. The claim check reads it. See the final answer.
The final answer
The model wrote this answer. The harness shows it to the scientist after the review.
The mean difference in extra hours of sleep between the two drugs is 1.58 hours. The 95% confidence interval ranges from 0.70 to 2.46 hours. The p-value is 0.0028, which is significant at the 0.05 level. This suggests that the second drug (group 2) provides more extra hours of sleep than the first drug (group 1).
Settings and step results that the answer does not mention. The harness adds them.
Step results that the answer does not mention, from the record:
- n1 inspect_table: 20 rows x 4 columns.

Settings used, from the decision record: Significance level (alpha): 0.05 · Paired test: true · Test family for two groups: t · Assume equal variances (unpaired t-test): false · Sidedness: two-sided.
Values that are not scored
- A trap value is the result of a wrong method, for example an unpaired test on paired data. A trap value in a main step means that the run used the wrong method. A trap value in a comparison run is correct, because the record keeps the scientist's choice.
- An optional value is a second result of the same method. The run can compute it or not.
- A reference value comes from a different program version or a check run by us. We show it for comparison.
| Item | Kind | Known value | Closest logged value | Tolerance | Outcome | Source of the known value |
|---|---|---|---|---|---|---|
welch_p_trapUnpaired Welch p (trap result) | trap | 0.07939 | 0.05n2 compare_two_groups | ± 0.0005 | not in the record | We calculated it with SciPy 1.x ttest_ind with equal_var=False |
Checks
Review findings
The review recorded 1 finding. A rule finding comes from a fixed check in the harness. A referee finding comes from a second model that reads the record. The harness shows the findings to the scientist with the final answer. The record does not mark a finding as fixed. Thus a finding from an early review round can apply to a draft that the model corrected later.
| Severity | From | Finding | Shown with the final answer |
|---|---|---|---|
| info | referee model | The p-value is reported with alpha but the test settings are not fully reported. | yes |
Numbers in the answer
The last claim check read 7 numbers in the answer. 7 numbers match a logged result. 0 numbers have no source in the record.
Deviations
The model did not try to change a choice of the scientist.
Failed tool calls
No tool call failed.
Data integrity
Each data file has the same SHA-256 hash now as at the time of the step that read it. Where the download script (fetch.sh) gives a hash, the file also has that hash. The run did not change the data.
| File | SHA-256 | Fetched data | Steps with this hash |
|---|---|---|---|
{data}/student1908-sleep/sleep.csv238 bytes | 5563ff4da6cf | same as the hash in the download script (fetch.sh) | n1, n2 |
A SHA-256 hash is a fingerprint of the file contents. If one byte of the file changes, the hash changes. The table shows the first 12 characters.
How to repeat it
Get the data. The script downloads the files and checks their SHA-256 hashes where it lists them.
CUVETTE_DATA={data} bash bench/papers/student1908-sleep/fetch.shRun the same case with Cuvette. The script gives the same answers from bench/papers/student1908-sleep/bench.yaml.
cuvette bench papers --papers student1908-sleep --models ollama:qwen3:8b
Repeat each step by hand in the program. For each step, the harness records a manual route: the menu path or the code that gives the same result. This list does not include comparison runs.
inspect_table(step n1)Code
print(pd.read_csv(path).describe(include='all'))path
{data}/student1908-sleep/sleep.csv- Note: The tool also counts distinct values and missing values for each column.
The manual route that the harness recorded
ga_biostats.inspect_table(path="{data}/student1908-sleep/sleep.csv")The manual route uses the same method. The note in the route gives the known difference.
compare_two_groups(step n2)Code
wide = df.pivot(index="ID", columns="group", values="extra") scipy.stats.ttest_1samp(wide[2] - wide[1], 0) # same as ttest_rel(wide[2], wide[1])- values column =
extra - pairing column =
ID - alternative =
two-sided
The manual route that the harness recorded
ga_biostats.compare_two_groups(path="{data}/student1908-sleep/sleep.csv", outcome="extra", group="group", test="t", paired=True, id_column="ID", alternative="two-sided", alpha=0.05, equal_variance=False)The manual route gives the same numbers. An automatic test in Cuvette checks this.
- values column =
Figure
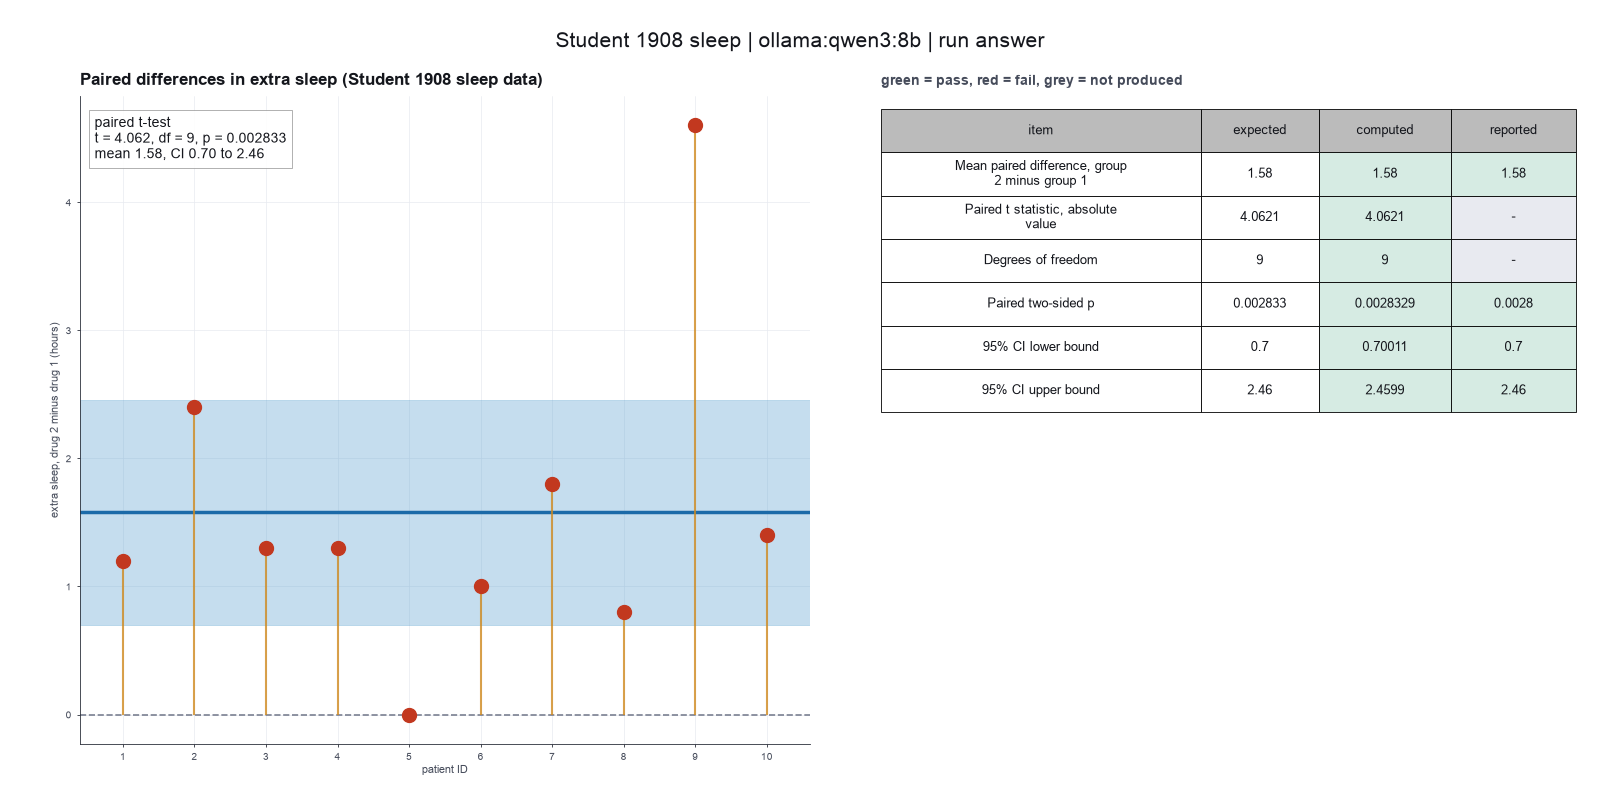
Run facts
| Model | qwen3:8b through Ollama, on our own computer |
| Date | 2026-10-09 11:45:17 UTC |
| End of run | the model gave a final answer |
| Time | 55 s |
| Requests to the model | 3 |
| Tokensunits of text that the model read and wrote | 27436 input, 205 output, 0 cache read, 0 cache write |
| Cost estimate | none: the model runs on our own computer |
| Tool calls | 2 (0 failed) |
| Adapters | biostats 0.2.0, program 0.30.3 |
| Session | 20261009-064517-4311 |
Code hash of each step (2)
| Step | Tool | Program version | Code hash |
|---|---|---|---|
| n1 | inspect_table | 0.30.3 | 603f546a1fe4 |
| n2 | compare_two_groups | 0.30.3 | c6e869486df4 |
The code hash is a fingerprint of the adapter name, the adapter version, the tool and its definition in the adapter. If one of these changes, the hash changes.